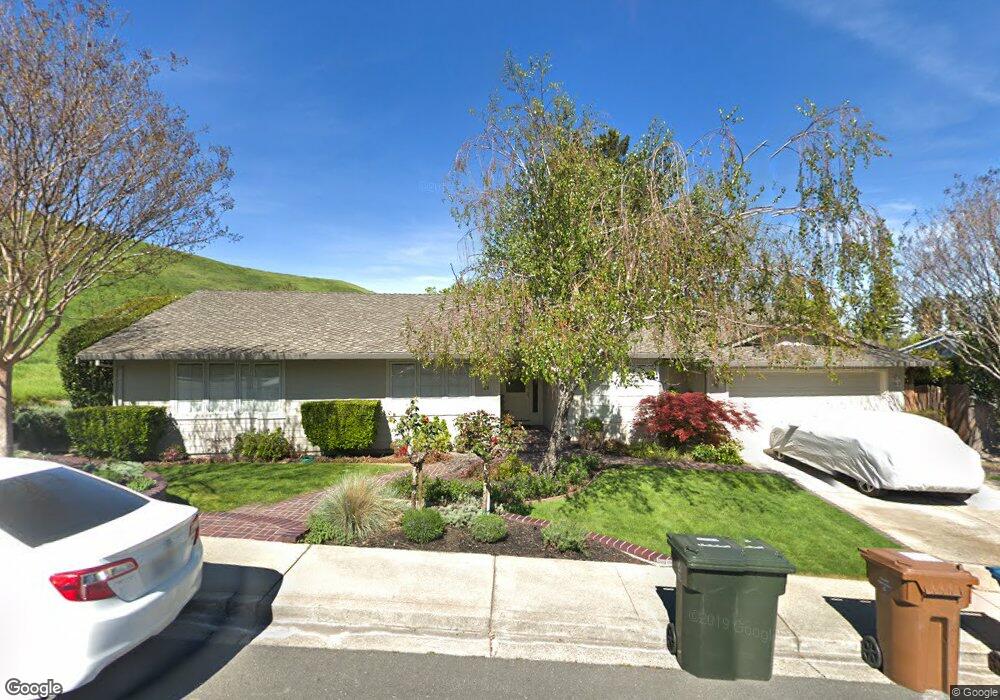
61 Regency Dr Clayton, CA 94517
Estimated Value: $1,030,000 - $1,132,000
4
Beds
3
Baths
2,276
Sq Ft
$476/Sq Ft
Est. Value
About This Home
This home is located at 61 Regency Dr, Clayton, CA 94517 and is currently estimated at $1,082,349, approximately $475 per square foot. 61 Regency Dr is a home located in Contra Costa County with nearby schools including Mt. Diablo Elementary School, Diablo View Middle School, and College Park High School.
Ownership History
Date
Name
Owned For
Owner Type
Purchase Details
Closed on
Oct 27, 2003
Sold by
Fannin Tommy A and Carson Ann E
Bought by
Fannin Tommy A and Carson Ann E
Current Estimated Value
Purchase Details
Closed on
Mar 19, 1998
Sold by
Fannin Tommy A Tre and Carson Ann E Tre
Bought by
Fannin Tommy A and Carson Ann E
Home Financials for this Owner
Home Financials are based on the most recent Mortgage that was taken out on this home.
Original Mortgage
$213,750
Interest Rate
7.06%
Mortgage Type
Purchase Money Mortgage
Purchase Details
Closed on
Mar 14, 1995
Sold by
Fannin Tommy A and Carson Ann E
Bought by
Fannin Tommy A and Carson Ann E
Create a Home Valuation Report for This Property
The Home Valuation Report is an in-depth analysis detailing your home's value as well as a comparison with similar homes in the area
Home Values in the Area
Average Home Value in this Area
Purchase History
| Date | Buyer | Sale Price | Title Company |
|---|---|---|---|
| Fannin Tommy A | -- | -- | |
| Fannin Tommy A | -- | Old Republic Title Company | |
| Fannin Tommy A | -- | -- |
Source: Public Records
Mortgage History
| Date | Status | Borrower | Loan Amount |
|---|---|---|---|
| Closed | Fannin Tommy A | $213,750 |
Source: Public Records
Tax History
| Year | Tax Paid | Tax Assessment Tax Assessment Total Assessment is a certain percentage of the fair market value that is determined by local assessors to be the total taxable value of land and additions on the property. | Land | Improvement |
|---|---|---|---|---|
| 2025 | $3,812 | $229,864 | $49,383 | $180,481 |
| 2024 | $3,611 | $225,358 | $48,415 | $176,943 |
| 2023 | $3,611 | $220,940 | $47,466 | $173,474 |
| 2022 | $3,537 | $216,609 | $46,536 | $170,073 |
| 2021 | $3,433 | $212,363 | $45,624 | $166,739 |
| 2019 | $3,347 | $206,067 | $44,272 | $161,795 |
| 2018 | $3,212 | $202,027 | $43,404 | $158,623 |
| 2017 | $3,093 | $198,066 | $42,553 | $155,513 |
| 2016 | $2,983 | $194,183 | $41,719 | $152,464 |
| 2015 | $2,918 | $191,267 | $41,093 | $150,174 |
| 2014 | $2,840 | $187,522 | $40,289 | $147,233 |
Source: Public Records
Map
Nearby Homes
- 33 El Molino Dr
- 23 Capistrano Ct
- 15 El Portal Ct
- 510 Mt Davidson Ct
- 186 Mt Wilson Way
- 367 Mt Washington Way
- 218 Mountaire Cir
- 249 Stranahan Cir
- 5849 Mitchell Canyon Ct
- 5817 Mitchell Canyon Ct
- 5795 Lewis Way
- 1048 Panadero Ct
- 1383 Shell Ln
- 1000 Froyd Rd
- 9005 Elk Dr
- 5 Pardi Ln
- 376 Blue Oak Ln
- 5535 Merritt Dr
- 5565 Jasper Ct
- 1421 Lydia Ln
- 55 Regency Dr
- 1 El Molino Dr
- 7 El Molino Dr
- 67 Regency Dr
- 15 El Molino Dr
- 24 Promontory Place
- 73 Regency Dr
- 20 Promontory Place
- 21 El Molino Dr
- 21 Promontory Place
- 43 Regency Dr
- 2 El Molino Dr
- 79 Regency Dr
- 8 El Molino Dr
- 27 El Molino Dr
- 44 Regency Dr
- 1 Rialto Dr
- 37 Regency Dr
- 16 Promontory Place
- 14 El Molino Dr
Your Personal Tour Guide
Ask me questions while you tour the home.