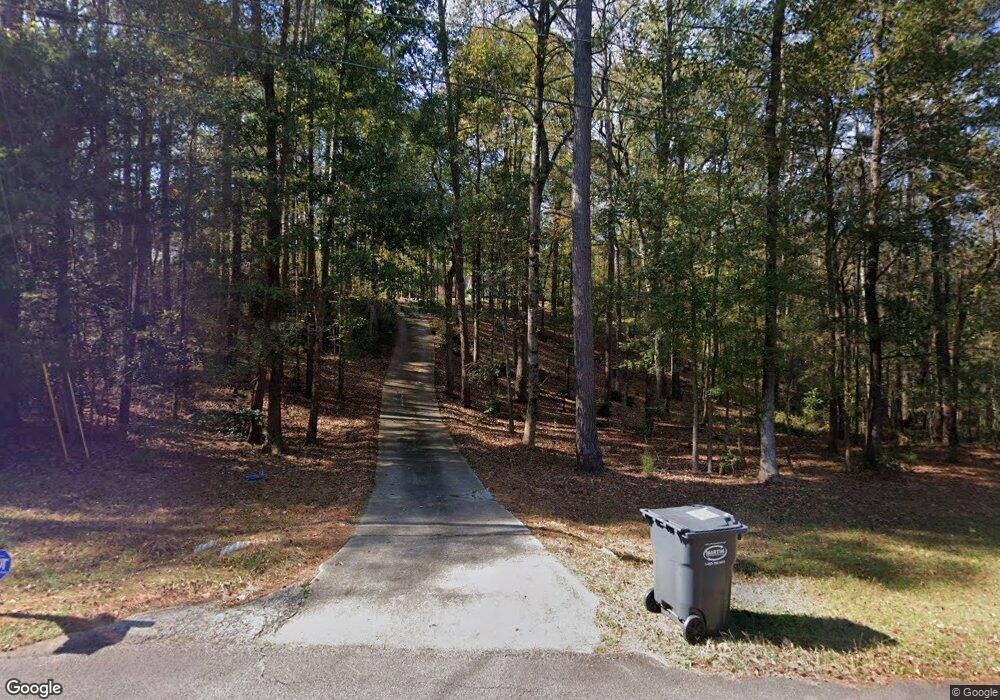
61 S Crossroad Lagrange, GA 30240
Estimated Value: $223,000 - $258,000
3
Beds
2
Baths
1,204
Sq Ft
$198/Sq Ft
Est. Value
About This Home
This home is located at 61 S Crossroad, Lagrange, GA 30240 and is currently estimated at $238,111, approximately $197 per square foot. 61 S Crossroad is a home located in Troup County with nearby schools including Hillcrest Elementary School, Franklin Forest Elementary School, and Hollis Hand Elementary School.
Ownership History
Date
Name
Owned For
Owner Type
Purchase Details
Closed on
Sep 7, 2023
Sold by
Mcguire William K
Bought by
Andrews Jennie
Current Estimated Value
Home Financials for this Owner
Home Financials are based on the most recent Mortgage that was taken out on this home.
Original Mortgage
$224,379
Outstanding Balance
$218,978
Interest Rate
6.96%
Mortgage Type
FHA
Estimated Equity
$19,133
Purchase Details
Closed on
Jul 13, 2018
Sold by
Fincher Victoria
Bought by
Mcguire William K
Purchase Details
Closed on
Oct 28, 2005
Sold by
Burmer John R
Bought by
Fincher Victoria
Purchase Details
Closed on
Aug 31, 2000
Sold by
Gregory Raymond B and Gregory Debra D
Bought by
Kathy John R and Kathy Jo Burmer
Purchase Details
Closed on
Aug 18, 1992
Sold by
Dan-Ric
Bought by
Gregory Raymond B and Gregory Debra D
Purchase Details
Closed on
Apr 8, 1992
Bought by
Dan-Ric
Purchase Details
Closed on
Nov 1, 1981
Purchase Details
Closed on
Jun 23, 1976
Create a Home Valuation Report for This Property
The Home Valuation Report is an in-depth analysis detailing your home's value as well as a comparison with similar homes in the area
Purchase History
| Date | Buyer | Sale Price | Title Company |
|---|---|---|---|
| Andrews Jennie | $233,700 | -- | |
| Mcguire William K | $105,000 | -- | |
| Fincher Victoria | $98,000 | -- | |
| Kathy John R | $88,000 | -- | |
| Gregory Raymond B | $58,800 | -- | |
| Dan-Ric | -- | -- | |
| -- | -- | -- | |
| -- | -- | -- |
Source: Public Records
Mortgage History
| Date | Status | Borrower | Loan Amount |
|---|---|---|---|
| Open | Andrews Jennie | $224,379 |
Source: Public Records
Tax History
| Year | Tax Paid | Tax Assessment Tax Assessment Total Assessment is a certain percentage of the fair market value that is determined by local assessors to be the total taxable value of land and additions on the property. | Land | Improvement |
|---|---|---|---|---|
| 2025 | $1,804 | $66,144 | $14,000 | $52,144 |
| 2024 | $1,534 | $56,244 | $14,000 | $42,244 |
| 2023 | $692 | $52,292 | $10,000 | $42,292 |
| 2022 | $560 | $46,452 | $10,000 | $36,452 |
| 2021 | $1,282 | $42,496 | $10,000 | $32,496 |
| 2020 | $1,282 | $42,496 | $10,000 | $32,496 |
| 2019 | $1,220 | $40,436 | $8,000 | $32,436 |
| 2018 | $1,103 | $36,556 | $8,000 | $28,556 |
| 2017 | $1,043 | $36,556 | $8,000 | $28,556 |
Source: Public Records
Map
Nearby Homes
- 111 Copper Creek Dr
- 120 Copper Creek Dr
- 114 Taylor Len Dr
- 166 Lakemont Dr
- 107 Edgemont Ct
- 135 Copper Creek Dr
- 143 Taylor Len Dr
- 178 Waterview Dr
- 219 E Yorktown Dr
- 0 Waterview Dr Unit 10558462
- 64 Waterview Ct
- 206 Sturbridge Dr
- 24 N Brooks Rd
- 113 Wellington Dr
- 0 River Club Dr Unit 10311961
- 107 Cameron Pointe Dr
- 102 Cameron Pointe Dr
- 155 Indian Bend Dr
- 111 Indian Bend Dr
- 130 Sunny Point Cir
- 61 South Crossroad
- 41 S Crossroad
- 23 S Crossroad
- 85 S Crossroad
- S South Crossroad
- 48 S Crossroad
- 99 S Crossroad
- 24 S Crossroad
- 680 Wares Cross Rd
- 109 South Crossroad
- 109 S Crossroad
- 698 Wares Cross Rd
- 634 Wares Cross Rd
- 714 Wares Cross Rd
- 114 S Crossroad
- 738 Wares Cross Rd
- 135 S Crossroad
- 610 Wares Cross Rd
- 770 Wares Cross Rd
- 146 S Crossroad
Your Personal Tour Guide
Ask me questions while you tour the home.