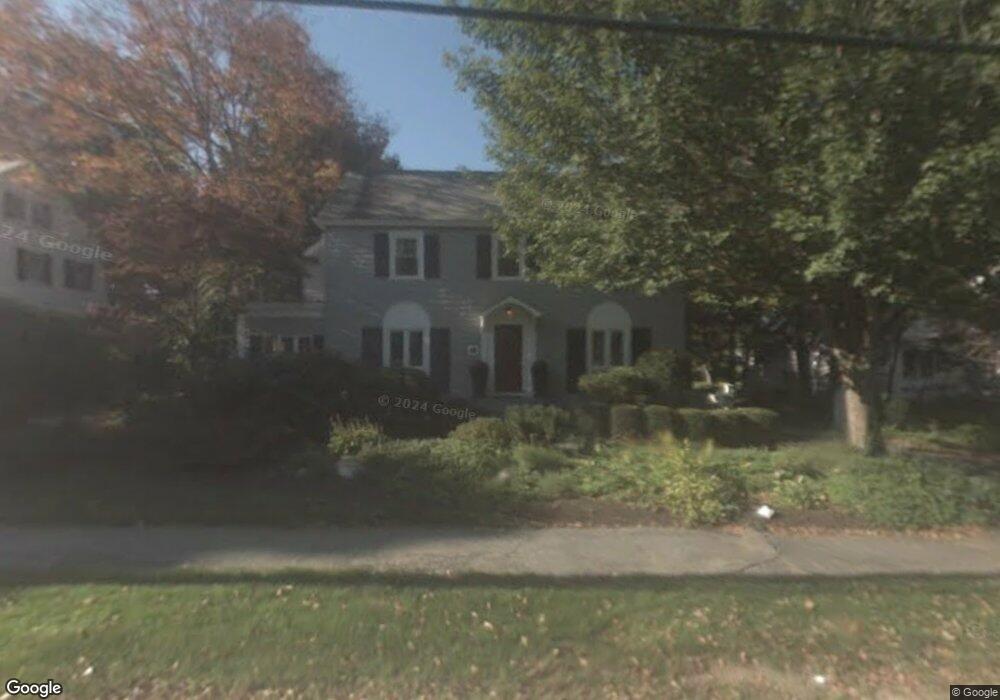
61 Salem St Andover, MA 01810
Phillips Academy NeighborhoodEstimated Value: $1,202,000 - $2,126,000
4
Beds
3
Baths
2,112
Sq Ft
$777/Sq Ft
Est. Value
About This Home
This home is located at 61 Salem St, Andover, MA 01810 and is currently estimated at $1,640,264, approximately $776 per square foot. 61 Salem St is a home located in Essex County with nearby schools including Bancroft Elementary School, Doherty Middle School, and Andover High School.
Ownership History
Date
Name
Owned For
Owner Type
Purchase Details
Closed on
Jan 8, 2025
Sold by
Hurley Liam J and Hurley Brigid
Bought by
Liam J Hurley Lt and Hurley
Current Estimated Value
Purchase Details
Closed on
Apr 14, 2000
Sold by
Hook Bruce G and Hook Lynn A
Bought by
Hurley Liam J and Hurley Brigid
Purchase Details
Closed on
Aug 23, 1996
Sold by
Salem Street Nt
Bought by
Hook Bruce G
Create a Home Valuation Report for This Property
The Home Valuation Report is an in-depth analysis detailing your home's value as well as a comparison with similar homes in the area
Home Values in the Area
Average Home Value in this Area
Purchase History
| Date | Buyer | Sale Price | Title Company |
|---|---|---|---|
| Liam J Hurley Lt | -- | None Available | |
| Liam J Hurley Lt | -- | None Available | |
| Hurley Liam J | $625,000 | -- | |
| Hook Bruce G | $503,500 | -- | |
| Hurley Liam J | $625,000 | -- | |
| Hook Bruce G | $503,500 | -- |
Source: Public Records
Mortgage History
| Date | Status | Borrower | Loan Amount |
|---|---|---|---|
| Previous Owner | Hook Bruce G | $500,000 | |
| Previous Owner | Hook Bruce G | $385,000 |
Source: Public Records
Tax History Compared to Growth
Tax History
| Year | Tax Paid | Tax Assessment Tax Assessment Total Assessment is a certain percentage of the fair market value that is determined by local assessors to be the total taxable value of land and additions on the property. | Land | Improvement |
|---|---|---|---|---|
| 2024 | $16,237 | $1,260,600 | $609,500 | $651,100 |
| 2023 | $15,485 | $1,133,600 | $549,200 | $584,400 |
| 2022 | $14,677 | $1,005,300 | $485,900 | $519,400 |
| 2021 | $14,047 | $918,700 | $441,700 | $477,000 |
| 2020 | $13,473 | $897,600 | $430,900 | $466,700 |
| 2019 | $13,358 | $874,800 | $418,200 | $456,600 |
| 2018 | $12,737 | $814,400 | $394,400 | $420,000 |
| 2017 | $12,191 | $803,100 | $386,600 | $416,500 |
| 2016 | $11,902 | $803,100 | $386,600 | $416,500 |
| 2015 | $11,445 | $764,500 | $371,700 | $392,800 |
Source: Public Records
Map
Nearby Homes
- 53 Salem St
- 104 Salem St
- 133B Salem
- 50 Hidden Rd
- 4 Hammond Way
- 31 Porter Rd
- 9 Chapman Ave
- 47 Abbot St
- 331 S Main St
- 25 Timothy Dr
- 204 Chestnut St
- Lot 7 Weeping Willow Dr
- 56 Sunset Rock Rd
- 61 Elm St Unit 61
- 32 Lucerne Dr
- 103 Central St
- 105 Central St
- 3 West Hollow
- 10 Maple Ave Unit 3
- 105 Elm St Unit A