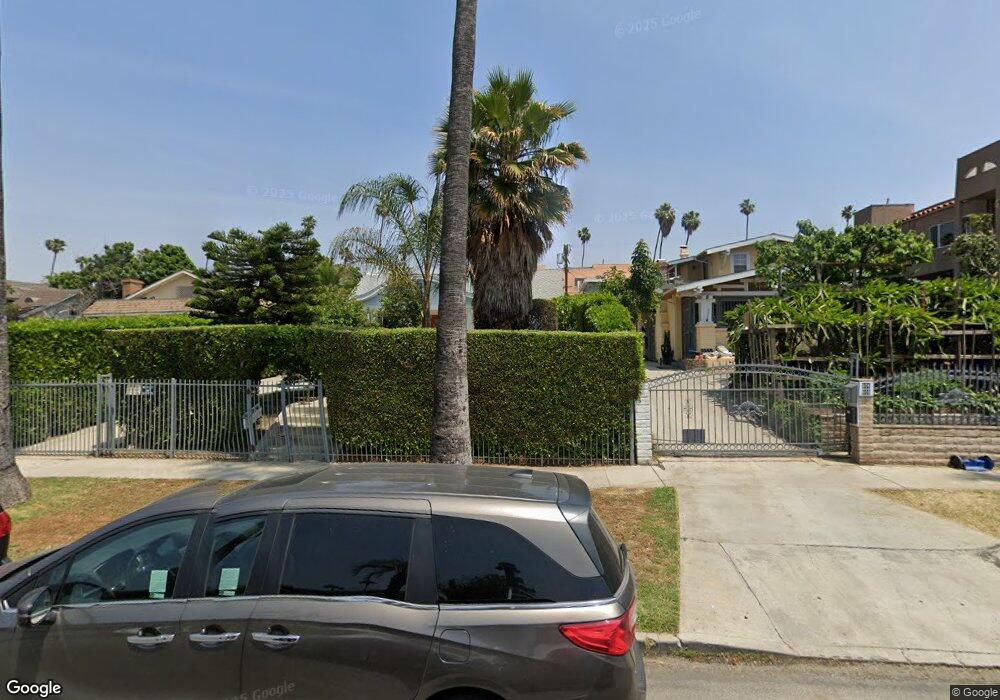
610 N Ardmore Ave Los Angeles, CA 90004
East Hollywood NeighborhoodEstimated Value: $1,060,512 - $8,244,000
3
Beds
1
Bath
1,687
Sq Ft
$1,795/Sq Ft
Est. Value
About This Home
This home is located at 610 N Ardmore Ave, Los Angeles, CA 90004 and is currently estimated at $3,028,378, approximately $1,795 per square foot. 610 N Ardmore Ave is a home located in Los Angeles County with nearby schools including Alexandria Avenue Elementary School, Virgil Middle School, and Belmont High School.
Ownership History
Date
Name
Owned For
Owner Type
Purchase Details
Closed on
May 23, 2003
Sold by
Martinez Froylan T
Bought by
Menjivar Maria
Current Estimated Value
Home Financials for this Owner
Home Financials are based on the most recent Mortgage that was taken out on this home.
Original Mortgage
$449,550
Outstanding Balance
$206,855
Interest Rate
6.6%
Mortgage Type
Purchase Money Mortgage
Estimated Equity
$2,821,523
Purchase Details
Closed on
Oct 19, 2001
Sold by
Rocha Alejandra
Bought by
Martinez Froylan T and Ocana Saul
Home Financials for this Owner
Home Financials are based on the most recent Mortgage that was taken out on this home.
Original Mortgage
$314,071
Interest Rate
6.87%
Mortgage Type
FHA
Purchase Details
Closed on
Aug 16, 2001
Sold by
Rocha Miguel Carcano
Bought by
Rocha Alejandra
Purchase Details
Closed on
Jun 27, 1997
Sold by
Luna Ramon C
Bought by
Rocha Jaime Carcano and Castillo Hector
Create a Home Valuation Report for This Property
The Home Valuation Report is an in-depth analysis detailing your home's value as well as a comparison with similar homes in the area
Home Values in the Area
Average Home Value in this Area
Purchase History
| Date | Buyer | Sale Price | Title Company |
|---|---|---|---|
| Menjivar Maria | $499,500 | Southland Title | |
| Martinez Froylan T | $319,500 | -- | |
| Ocana Saul | -- | -- | |
| Rocha Alejandra | -- | Southland Title | |
| Rocha Jaime Carcano | -- | -- |
Source: Public Records
Mortgage History
| Date | Status | Borrower | Loan Amount |
|---|---|---|---|
| Open | Menjivar Maria | $449,550 | |
| Previous Owner | Martinez Froylan T | $314,071 |
Source: Public Records
Tax History Compared to Growth
Tax History
| Year | Tax Paid | Tax Assessment Tax Assessment Total Assessment is a certain percentage of the fair market value that is determined by local assessors to be the total taxable value of land and additions on the property. | Land | Improvement |
|---|---|---|---|---|
| 2025 | $8,896 | $723,422 | $552,385 | $171,037 |
| 2024 | $8,896 | $709,238 | $541,554 | $167,684 |
| 2023 | $8,731 | $695,333 | $530,936 | $164,397 |
| 2022 | $8,335 | $681,700 | $520,526 | $161,174 |
| 2021 | $8,229 | $668,334 | $510,320 | $158,014 |
| 2019 | $7,987 | $648,513 | $495,185 | $153,328 |
| 2018 | $7,849 | $635,798 | $485,476 | $150,322 |
| 2016 | $7,503 | $611,111 | $466,625 | $144,486 |
| 2015 | $7,395 | $601,932 | $459,616 | $142,316 |
| 2014 | $6,291 | $497,000 | $379,500 | $117,500 |
Source: Public Records
Map
Nearby Homes
- 564 N Normandie Ave
- 542 Normandie Ave
- 632 N Mariposa Ave
- 4504 Maplewood Ave
- 4457 Rosewood Ave
- 635 N Harvard Blvd
- 510 N Harvard Blvd
- 4511 Rosewood Ave
- 739 N Mariposa Ave
- 4713 Clinton St
- 803 N Kingsley Dr
- 519 N Alexandria Ave
- 741 N Harvard Blvd
- 422 Normandie Place
- 743 N Alexandria Ave
- 512 Alexandria Ave
- 605 N Hobart Blvd
- 800 N Hobart Blvd
- 4572 Rosewood Ave
- 527 N Hobart Blvd
- 614 N Ardmore Ave
- 606 N Ardmore Ave
- 620 N Ardmore Ave
- 624 N Ardmore Ave
- 558 N Ardmore Ave
- 619 N Normandie Ave
- 619 N Normandie Ave Unit 14
- 619 N Normandie Ave Unit 4
- 619 N Normandie Ave
- 601 N Normandie Ave
- 621 N Normandie Ave
- 628 N Ardmore Ave
- 554 N Ardmore Ave
- 559 N Normandie Ave Unit 206
- 559 N Normandie Ave Unit 101
- 559 N Normandie Ave Unit 207
- 559 N Normandie Ave
- 609 N Ardmore Ave
- 634 N Ardmore Ave
- 629 1/2 N Normandie Ave