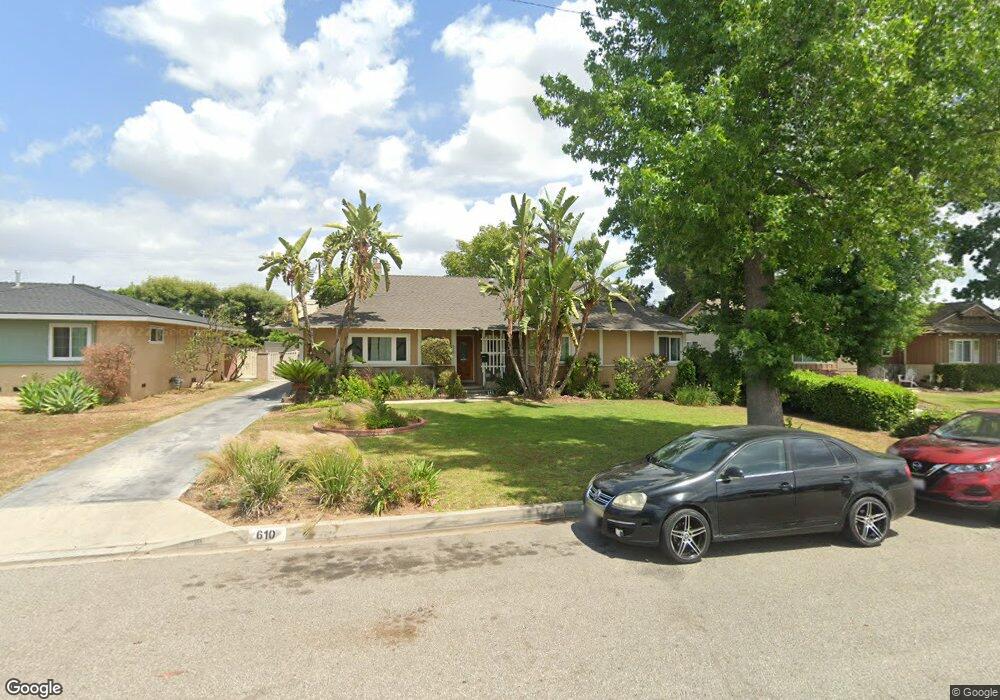
610 N Eileen Ave West Covina, CA 91791
Estimated Value: $856,000 - $900,000
4
Beds
2
Baths
1,739
Sq Ft
$502/Sq Ft
Est. Value
About This Home
This home is located at 610 N Eileen Ave, West Covina, CA 91791 and is currently estimated at $872,123, approximately $501 per square foot. 610 N Eileen Ave is a home located in Los Angeles County with nearby schools including Rowland Avenue Elementary School, Traweek Middle School, and Covina High School.
Ownership History
Date
Name
Owned For
Owner Type
Purchase Details
Closed on
Dec 12, 2023
Sold by
Corral Family Trust
Bought by
Corral Andrew
Current Estimated Value
Purchase Details
Closed on
Mar 13, 2016
Sold by
Corral Jose R
Bought by
Corral Jose R and Corral Family Trust
Purchase Details
Closed on
Aug 21, 2003
Sold by
Corral Minerva
Bought by
Corral Jose R
Home Financials for this Owner
Home Financials are based on the most recent Mortgage that was taken out on this home.
Original Mortgage
$251,250
Interest Rate
6.3%
Mortgage Type
Stand Alone First
Purchase Details
Closed on
Apr 23, 1999
Sold by
Grimm Richard W
Bought by
Corral Jose R and Corral Minerva
Home Financials for this Owner
Home Financials are based on the most recent Mortgage that was taken out on this home.
Original Mortgage
$166,500
Interest Rate
6.86%
Mortgage Type
Seller Take Back
Purchase Details
Closed on
Nov 14, 1996
Sold by
Grimm Richard W
Bought by
Grimm Richard W and Grimm Elaine O
Create a Home Valuation Report for This Property
The Home Valuation Report is an in-depth analysis detailing your home's value as well as a comparison with similar homes in the area
Home Values in the Area
Average Home Value in this Area
Purchase History
| Date | Buyer | Sale Price | Title Company |
|---|---|---|---|
| Corral Andrew | -- | None Listed On Document | |
| Corral Jose R | -- | None Available | |
| Corral Jose R | -- | None Available | |
| Corral Jose R | -- | Southland Title | |
| Corral Jose R | $185,000 | -- | |
| Grimm Richard W | -- | -- |
Source: Public Records
Mortgage History
| Date | Status | Borrower | Loan Amount |
|---|---|---|---|
| Previous Owner | Corral Jose R | $251,250 | |
| Previous Owner | Corral Jose R | $166,500 |
Source: Public Records
Tax History Compared to Growth
Tax History
| Year | Tax Paid | Tax Assessment Tax Assessment Total Assessment is a certain percentage of the fair market value that is determined by local assessors to be the total taxable value of land and additions on the property. | Land | Improvement |
|---|---|---|---|---|
| 2025 | $4,010 | $300,826 | $162,231 | $138,595 |
| 2024 | $4,010 | $294,928 | $159,050 | $135,878 |
| 2023 | $3,830 | $278,744 | $147,810 | $130,934 |
| 2022 | $3,779 | $273,279 | $144,912 | $128,367 |
| 2021 | $3,718 | $267,921 | $142,071 | $125,850 |
| 2019 | $3,625 | $259,976 | $137,858 | $122,118 |
| 2018 | $3,443 | $254,879 | $135,155 | $119,724 |
| 2016 | $3,232 | $244,983 | $129,907 | $115,076 |
| 2015 | $3,153 | $241,304 | $127,956 | $113,348 |
| 2014 | $3,118 | $236,578 | $125,450 | $111,128 |
Source: Public Records
Map
Nearby Homes
- 501 Embrook Way
- 509 Tamarind Way Unit B
- 708 N La Breda Ave
- 229 Scratch Rd
- 1147 W Badillo St Unit G
- 1147 W Badillo St Unit D
- 1714 E Idahome St
- 1327 E Thelborn St
- 1715 E Mardina St
- 543 W Puente St Unit 3
- 511 W Puente St Unit 4
- 511 W Puente St Unit 1
- 1626 E Mardina St
- 1122 W Glentana St
- 123 S Hollenbeck Ave
- 193 S Hollenbeck Ave
- 410 N Lyall Ave
- 131 S Myrtlewood St
- 1423 W San Bernardino Rd Unit A
- 577 S Albertson Ave
- 616 N Eileen Ave
- 606 N Eileen Ave
- 600 N Eileen Ave
- 622 N Eileen Ave
- 611 N Eileen Ave
- 607 N Eileen Ave
- 617 N Eileen Ave
- 630 N Eileen Ave
- 601 N Eileen Ave
- 1653 Rosewell Rd
- 1635 E Eckerman Ave
- 636 N Eileen Ave
- 1629 E Eckerman Ave
- 610 N Homerest Ave
- 616 N Homerest Ave
- 606 N Homerest Ave
- 600 N Homerest Ave
- 1623 E Eckerman Ave
- 552 N Homerest Ave
- 642 N Eileen Ave