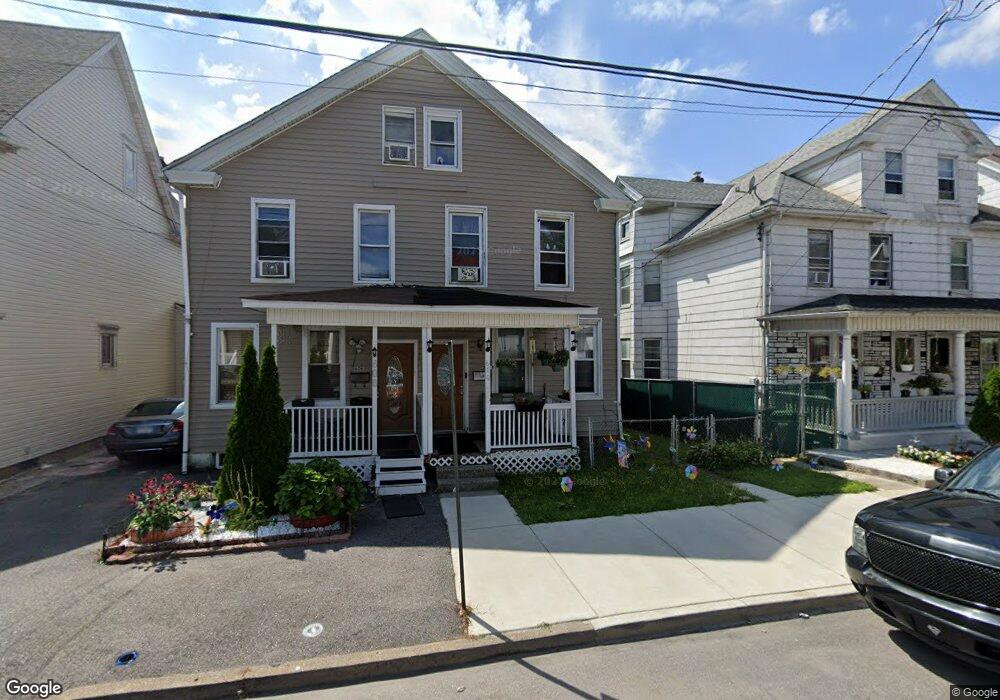
610 N Vine St Hazleton, PA 18201
Estimated Value: $132,000 - $178,000
3
Beds
2
Baths
1,860
Sq Ft
$85/Sq Ft
Est. Value
About This Home
This home is located at 610 N Vine St, Hazleton, PA 18201 and is currently estimated at $158,081, approximately $84 per square foot. 610 N Vine St is a home located in Luzerne County with nearby schools including Hazleton Area High School, Holy Family Academy, and Immanuel Christian School.
Ownership History
Date
Name
Owned For
Owner Type
Purchase Details
Closed on
Sep 20, 2017
Sold by
Secretary Of Hud
Bought by
Jc Grove Llc
Current Estimated Value
Purchase Details
Closed on
Jul 28, 2016
Sold by
Ocwen Loan Servicing Llc
Bought by
Secretary Of Hud
Purchase Details
Closed on
Apr 25, 2016
Sold by
Hernandez Enrique F and Case #605
Bought by
Ocwen Loan Servicing Llc
Purchase Details
Closed on
Oct 1, 2008
Sold by
Gregg John I and Gregg Theresa A
Bought by
Espinal Rodolfo
Purchase Details
Closed on
Dec 11, 2006
Sold by
Gregg John I and Gregg Theresa A
Bought by
Espinal Rodolfo
Create a Home Valuation Report for This Property
The Home Valuation Report is an in-depth analysis detailing your home's value as well as a comparison with similar homes in the area
Home Values in the Area
Average Home Value in this Area
Purchase History
| Date | Buyer | Sale Price | Title Company |
|---|---|---|---|
| Jc Grove Llc | $31,200 | None Available | |
| Secretary Of Hud | -- | Servicelink | |
| Ocwen Loan Servicing Llc | $1,517 | None Available | |
| Espinal Rodolfo | -- | None Available | |
| Espinal Rodolfo | $2,910 | None Available |
Source: Public Records
Tax History Compared to Growth
Tax History
| Year | Tax Paid | Tax Assessment Tax Assessment Total Assessment is a certain percentage of the fair market value that is determined by local assessors to be the total taxable value of land and additions on the property. | Land | Improvement |
|---|---|---|---|---|
| 2025 | $1,178 | $41,000 | $17,000 | $24,000 |
| 2024 | $1,103 | $41,000 | $17,000 | $24,000 |
| 2023 | $1,032 | $41,000 | $17,000 | $24,000 |
| 2022 | $1,024 | $41,000 | $17,000 | $24,000 |
| 2021 | $1,000 | $41,000 | $17,000 | $24,000 |
| 2020 | $894 | $41,000 | $17,000 | $24,000 |
| 2019 | $922 | $41,000 | $17,000 | $24,000 |
| 2018 | $1,514 | $69,700 | $22,100 | $47,600 |
| 2017 | $1,396 | $69,700 | $22,100 | $47,600 |
| 2016 | $993 | $69,700 | $22,100 | $47,600 |
| 2015 | $994 | $69,700 | $22,100 | $47,600 |
| 2014 | $994 | $69,700 | $22,100 | $47,600 |
Source: Public Records
Map
Nearby Homes
- 572 N Vine St
- 530 N Lee Ct
- 1087 N Rear Locust St
- 714 Alter St
- 127 W Diamond Ave
- 14 W 5th St
- 523 N Laurel St
- 739 N Church St
- 163 N Church St
- 522 N James St
- ER.126 W Aspen St
- 738 N Manhattan Ct
- 538 Carson St Unit 40
- 827 N Vine St
- 19 W 14th St
- 782 N James St
- 756 Peace St
- 837 N Laurel St
- 56 N Laurel St
- 52 N Laurel St