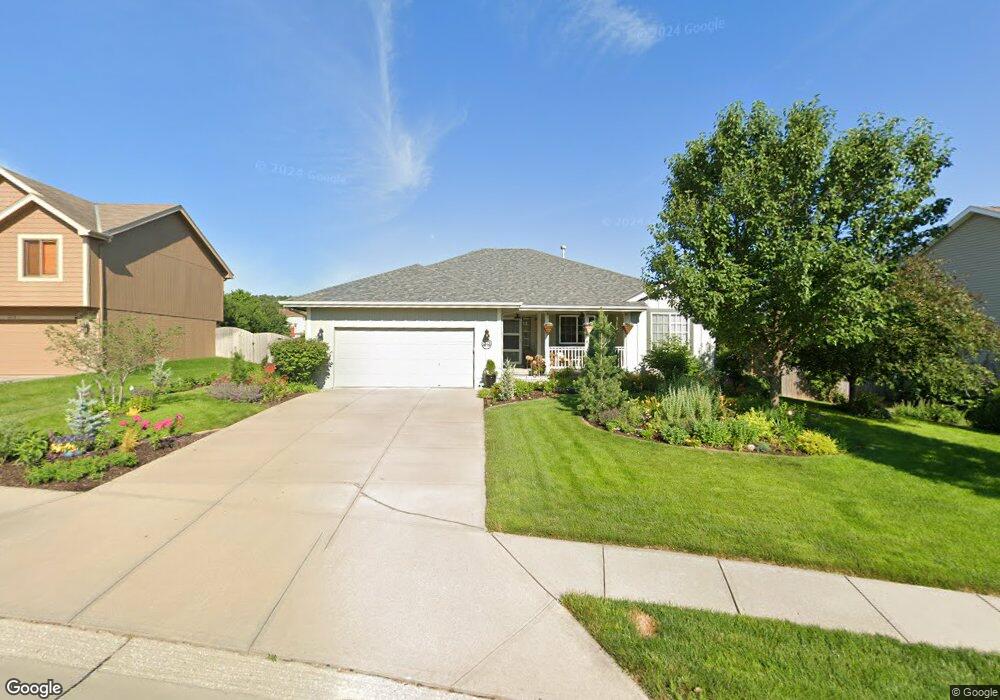
610 Ruby Rd Papillion, NE 68133
Estimated Value: $328,621 - $391,000
3
Beds
5
Baths
1,453
Sq Ft
$246/Sq Ft
Est. Value
About This Home
This home is located at 610 Ruby Rd, Papillion, NE 68133 and is currently estimated at $357,405, approximately $245 per square foot. 610 Ruby Rd is a home located in Sarpy County with nearby schools including Pawnee Elementary School, Bryan Middle School, and Bryan High School.
Ownership History
Date
Name
Owned For
Owner Type
Purchase Details
Closed on
Sep 7, 2012
Sold by
Kozisek Michael A
Bought by
Kozisek Michael A and Swaney Shawna L
Current Estimated Value
Home Financials for this Owner
Home Financials are based on the most recent Mortgage that was taken out on this home.
Original Mortgage
$144,000
Outstanding Balance
$19,959
Interest Rate
3.49%
Estimated Equity
$337,446
Purchase Details
Closed on
Nov 30, 2010
Sold by
Kozisek Tiffany R
Bought by
Kozisek Michael A
Purchase Details
Closed on
Sep 23, 2005
Sold by
Galaxy Homes Llc
Bought by
Kozisek Michael A and Kozisek Tiffany R
Home Financials for this Owner
Home Financials are based on the most recent Mortgage that was taken out on this home.
Original Mortgage
$145,600
Interest Rate
5.65%
Purchase Details
Closed on
Jul 11, 2005
Sold by
Rogers Development Inc
Bought by
Galaxy Homes Llc
Home Financials for this Owner
Home Financials are based on the most recent Mortgage that was taken out on this home.
Original Mortgage
$140,000
Interest Rate
5.63%
Mortgage Type
Construction
Create a Home Valuation Report for This Property
The Home Valuation Report is an in-depth analysis detailing your home's value as well as a comparison with similar homes in the area
Home Values in the Area
Average Home Value in this Area
Purchase History
| Date | Buyer | Sale Price | Title Company |
|---|---|---|---|
| Kozisek Michael A | $99,000 | Omaha Title & Escrow Inc | |
| Kozisek Michael A | -- | None Available | |
| Kozisek Michael A | $183,000 | -- | |
| Galaxy Homes Llc | $41,142 | -- |
Source: Public Records
Mortgage History
| Date | Status | Borrower | Loan Amount |
|---|---|---|---|
| Open | Kozisek Michael A | $144,000 | |
| Previous Owner | Kozisek Michael A | $145,600 | |
| Previous Owner | Galaxy Homes Llc | $140,000 |
Source: Public Records
Tax History
| Year | Tax Paid | Tax Assessment Tax Assessment Total Assessment is a certain percentage of the fair market value that is determined by local assessors to be the total taxable value of land and additions on the property. | Land | Improvement |
|---|---|---|---|---|
| 2025 | $6,059 | $327,737 | $50,000 | $277,737 |
| 2024 | $6,934 | $324,018 | $50,000 | $274,018 |
| 2023 | $6,934 | $296,737 | $48,000 | $248,737 |
| 2022 | $6,113 | $258,668 | $45,000 | $213,668 |
| 2021 | $5,940 | $249,257 | $45,000 | $204,257 |
| 2020 | $5,719 | $238,963 | $45,000 | $193,963 |
| 2019 | $5,433 | $227,739 | $45,000 | $182,739 |
| 2018 | $5,282 | $219,368 | $45,000 | $174,368 |
| 2017 | $4,951 | $204,763 | $45,000 | $159,763 |
| 2016 | $5,105 | $199,452 | $34,000 | $165,452 |
| 2015 | $4,904 | $188,684 | $32,000 | $156,684 |
| 2014 | $4,981 | $186,308 | $32,000 | $154,308 |
| 2012 | -- | $184,294 | $32,000 | $152,294 |
Source: Public Records
Map
Nearby Homes
- 605 Ruby Rd
- 2309 Alexandra Rd
- 604 Castle Pine Dr
- 2205 Alexandra Rd
- 2608 Alexandra Rd
- 6215 Harvest Dr
- 9115 Alexandra Rd
- 2009 Aberdeen Dr
- 9111 Alexandra Rd
- 2107 Leigh St
- 12901 S 65th St
- 2124 Betsy Ave
- 2141 Ashwood Ave
- 8522 S 63rd St
- 8811 S 65th St
- 13010 S 66th Ave
- 13014 S 66th Ave
- 508 Oakwood Dr
- 8707 S 68th St
- 209 Sea Pines Dr
Your Personal Tour Guide
Ask me questions while you tour the home.