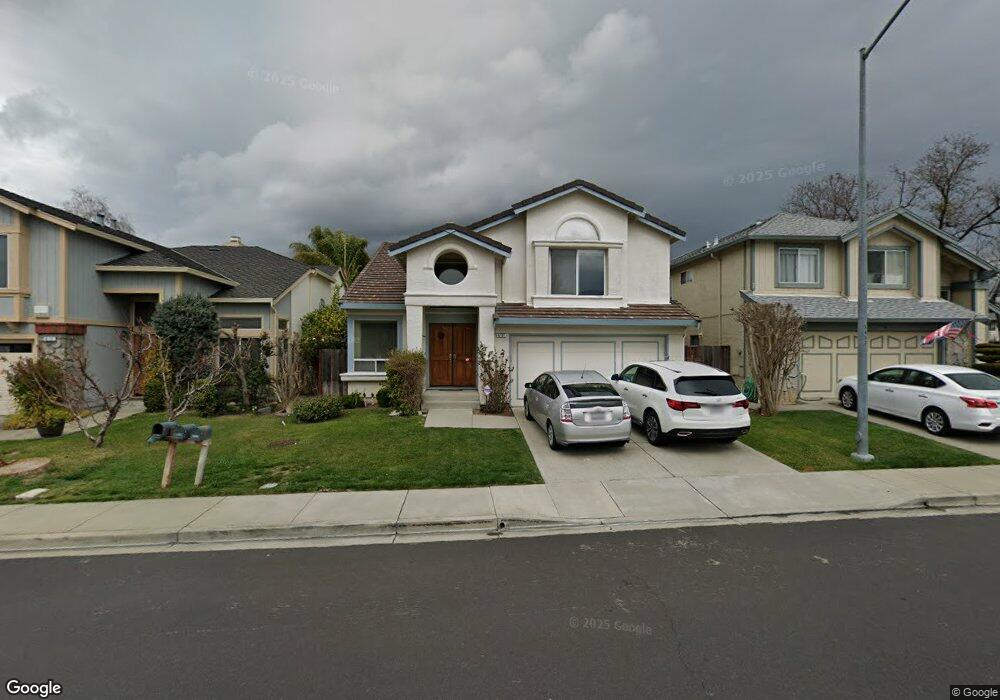
6107 Via de Los Cerros Pleasanton, CA 94566
Valley Trails NeighborhoodEstimated Value: $1,767,000 - $1,955,000
4
Beds
3
Baths
2,420
Sq Ft
$776/Sq Ft
Est. Value
About This Home
This home is located at 6107 Via de Los Cerros, Pleasanton, CA 94566 and is currently estimated at $1,879,023, approximately $776 per square foot. 6107 Via de Los Cerros is a home located in Alameda County with nearby schools including Donlon Elementary School, Thomas S. Hart Middle School, and Foothill High School.
Ownership History
Date
Name
Owned For
Owner Type
Purchase Details
Closed on
Jul 28, 2014
Sold by
Takenaka Yoshinori and Taken Naoko
Bought by
Zhu Qing K and Song Huiling
Current Estimated Value
Home Financials for this Owner
Home Financials are based on the most recent Mortgage that was taken out on this home.
Original Mortgage
$745,000
Interest Rate
3.37%
Mortgage Type
Adjustable Rate Mortgage/ARM
Purchase Details
Closed on
Oct 29, 2002
Sold by
Takenaka Yoshinori and Takenaka Naoko
Bought by
Takenaka Yoshinori and Takenaka Naoko
Purchase Details
Closed on
Mar 22, 1999
Sold by
Kwik Han B & Hoa S
Bought by
Takenaka Yoshinori and Takenaka Naoko
Purchase Details
Closed on
Dec 22, 1998
Sold by
Kwik Han B & Hoa S
Bought by
Kwik Han Bien and Kwik Hoa Sui
Home Financials for this Owner
Home Financials are based on the most recent Mortgage that was taken out on this home.
Original Mortgage
$310,000
Interest Rate
4.37%
Purchase Details
Closed on
Jun 15, 1996
Sold by
Kwik Han B & Hoa S
Bought by
Kwik Han Bien and Kwik Hoa Sui
Create a Home Valuation Report for This Property
The Home Valuation Report is an in-depth analysis detailing your home's value as well as a comparison with similar homes in the area
Home Values in the Area
Average Home Value in this Area
Purchase History
| Date | Buyer | Sale Price | Title Company |
|---|---|---|---|
| Zhu Qing K | $932,000 | Chicago Title Company | |
| Takenaka Yoshinori | -- | -- | |
| Takenaka Yoshinori | $459,000 | Old Republic Title Company | |
| Kwik Han Bien | -- | Chicago Title Co | |
| Kwik Han Bien | -- | -- |
Source: Public Records
Mortgage History
| Date | Status | Borrower | Loan Amount |
|---|---|---|---|
| Previous Owner | Zhu Qing K | $745,000 | |
| Previous Owner | Kwik Han Bien | $310,000 |
Source: Public Records
Tax History Compared to Growth
Tax History
| Year | Tax Paid | Tax Assessment Tax Assessment Total Assessment is a certain percentage of the fair market value that is determined by local assessors to be the total taxable value of land and additions on the property. | Land | Improvement |
|---|---|---|---|---|
| 2025 | $12,852 | $1,113,086 | $336,026 | $784,060 |
| 2024 | $12,852 | $1,091,128 | $329,438 | $768,690 |
| 2023 | $12,704 | $1,076,598 | $322,979 | $753,619 |
| 2022 | $12,034 | $1,048,490 | $316,647 | $738,843 |
| 2021 | $11,725 | $1,027,798 | $310,439 | $724,359 |
| 2020 | $11,574 | $1,024,193 | $307,258 | $716,935 |
| 2019 | $11,715 | $1,004,117 | $301,235 | $702,882 |
| 2018 | $11,477 | $984,434 | $295,330 | $689,104 |
| 2017 | $11,182 | $965,131 | $289,539 | $675,592 |
| 2016 | $10,324 | $946,212 | $283,863 | $662,349 |
| 2015 | $10,131 | $932,000 | $279,600 | $652,400 |
| 2014 | $6,621 | $586,982 | $176,094 | $410,888 |
Source: Public Records
Map
Nearby Homes
- 6083 Corte Montanas
- 6056 Corte Encinas
- 5988 Corte Cerritos
- 6450 Calle Esperanza
- 5995 Via Del Cielo
- 3162 Paseo Robles
- 3110 Paseo Robles
- 6686 Via San Blas
- 3636 Shenandoah Ct
- 2545 Corte Rivera
- 3530 Carlsbad Ct
- 3702 Gettysburg Ct N
- 5550 Black Ave
- 5522 Corte Del Cajon
- 1582 Calle Enrique
- 7444 Pecan Ct
- 1550 Calle Enrique
- 6355 Singletree Way
- 5254 Ridgevale Way
- 2320 Sandpiper Way
- 6113 Via de Los Cerros
- 6101 Via de Los Cerros
- 2804 Camino Segura
- 6119 Via de Los Cerros
- 2810 Camino Segura
- 6302 Camino Del Lago
- 2752 Camino Segura
- 6294 Camino Del Lago
- 6125 Via de Los Cerros
- 2781 Calle de la Loma
- 6081 Via de Los Cerros
- 6081 Via de Los Cerros
- 2816 Camino Segura
- 6310 Camino Del Lago
- 6131 Via de Los Cerros
- 6288 Camino Del Lago
- 6073 Via de Los Cerros
- 2748 Camino Segura
- 2775 Calle de la Loma
- 2822 Camino Segura