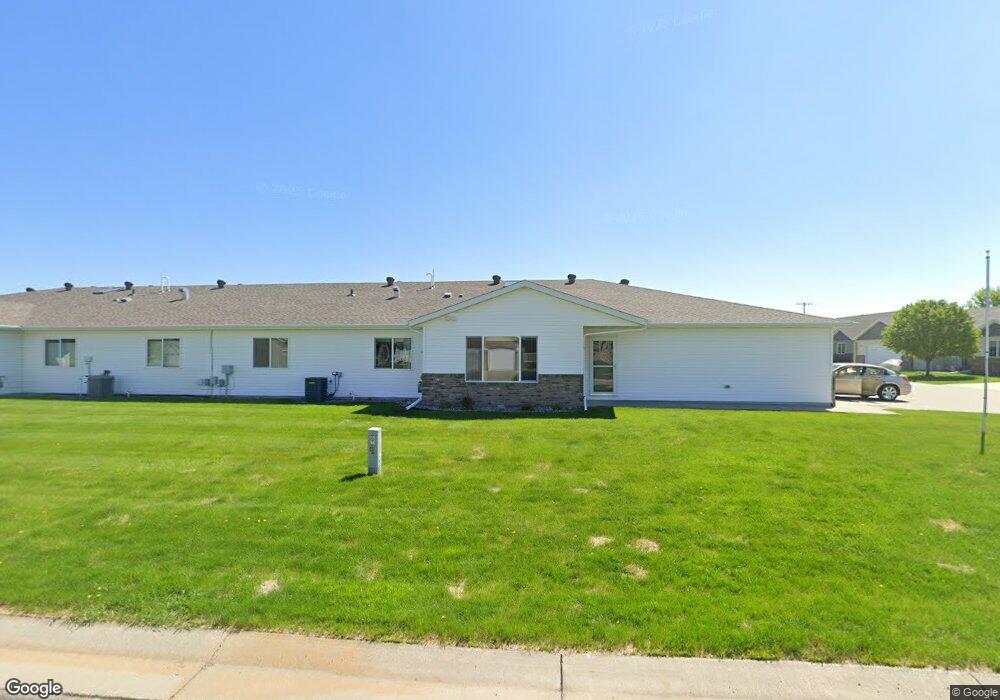
611 2nd St NW Unit NW Dilworth, MN 56529
Estimated Value: $260,000 - $267,000
2
Beds
2
Baths
1,305
Sq Ft
$202/Sq Ft
Est. Value
About This Home
This home is located at 611 2nd St NW Unit NW, Dilworth, MN 56529 and is currently estimated at $263,076, approximately $201 per square foot. 611 2nd St NW Unit NW is a home located in Clay County with nearby schools including Dilworth-Glyndon-Felton Middle School, Dilworth-Glyndon-Felton Senior High School, and Park Christian School.
Ownership History
Date
Name
Owned For
Owner Type
Purchase Details
Closed on
Sep 26, 2025
Sold by
Mahlum Jeffrey and Stelter Donna
Bought by
Johnson Richard and Johnson Robin
Current Estimated Value
Purchase Details
Closed on
Feb 22, 2019
Sold by
Benson Belinda G and Benson Michael A
Bought by
Huber Jane
Purchase Details
Closed on
Apr 3, 2008
Sold by
Todd Nelson Construction Inc
Bought by
Anderson Carl G and Anderson Janice M
Home Financials for this Owner
Home Financials are based on the most recent Mortgage that was taken out on this home.
Original Mortgage
$74,900
Interest Rate
6.09%
Mortgage Type
New Conventional
Create a Home Valuation Report for This Property
The Home Valuation Report is an in-depth analysis detailing your home's value as well as a comparison with similar homes in the area
Home Values in the Area
Average Home Value in this Area
Purchase History
| Date | Buyer | Sale Price | Title Company |
|---|---|---|---|
| Johnson Richard | $252,000 | None Listed On Document | |
| Huber Jane | $184,652 | Title Co Of Fargo | |
| Anderson Carl G | $144,900 | None Available |
Source: Public Records
Mortgage History
| Date | Status | Borrower | Loan Amount |
|---|---|---|---|
| Previous Owner | Anderson Carl G | $74,900 |
Source: Public Records
Tax History Compared to Growth
Tax History
| Year | Tax Paid | Tax Assessment Tax Assessment Total Assessment is a certain percentage of the fair market value that is determined by local assessors to be the total taxable value of land and additions on the property. | Land | Improvement |
|---|---|---|---|---|
| 2025 | $2,894 | $246,800 | $23,300 | $223,500 |
| 2024 | $2,894 | $233,700 | $23,300 | $210,400 |
| 2023 | $2,936 | $234,000 | $23,300 | $210,700 |
| 2022 | $2,610 | $212,700 | $23,300 | $189,400 |
| 2021 | $2,370 | $185,100 | $23,300 | $161,800 |
| 2020 | $2,134 | $173,100 | $23,300 | $149,800 |
| 2019 | $1,944 | $160,300 | $23,300 | $137,000 |
| 2018 | $1,878 | $160,300 | $23,300 | $137,000 |
| 2017 | $2,028 | $160,300 | $23,300 | $137,000 |
| 2016 | $1,826 | $162,000 | $17,500 | $144,500 |
| 2015 | $863 | $146,000 | $11,600 | $134,400 |
| 2014 | $1,696 | $146,000 | $11,600 | $134,400 |
Source: Public Records
Map
Nearby Homes