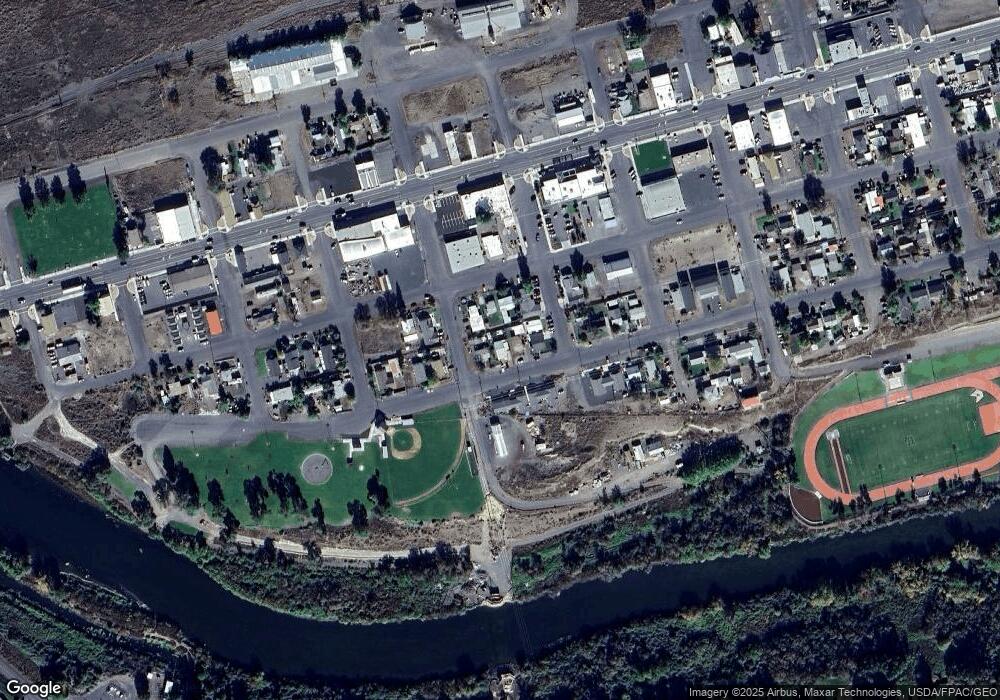
611 8th St Umatilla, OR 97882
Estimated Value: $183,000 - $209,000
3
Beds
1
Bath
1,109
Sq Ft
$173/Sq Ft
Est. Value
About This Home
This home is located at 611 8th St, Umatilla, OR 97882 and is currently estimated at $191,328, approximately $172 per square foot. 611 8th St is a home located in Umatilla County with nearby schools including McNary Heights Elementary School, Clara Brownell Middle School, and Umatilla High School.
Ownership History
Date
Name
Owned For
Owner Type
Purchase Details
Closed on
Sep 19, 2017
Sold by
Home Town Rentals Llc
Bought by
Montoya Martin and Montoya Brenda
Current Estimated Value
Purchase Details
Closed on
Apr 7, 2010
Sold by
Deutsche Bank Trust Company Americas
Bought by
Montoya Martin S
Home Financials for this Owner
Home Financials are based on the most recent Mortgage that was taken out on this home.
Original Mortgage
$58,163
Interest Rate
4.91%
Mortgage Type
New Conventional
Create a Home Valuation Report for This Property
The Home Valuation Report is an in-depth analysis detailing your home's value as well as a comparison with similar homes in the area
Home Values in the Area
Average Home Value in this Area
Purchase History
| Date | Buyer | Sale Price | Title Company |
|---|---|---|---|
| Montoya Martin | $92,099 | Pioneer Title Co | |
| Montoya Martin S | $57,000 | Fidelity Natl Title Co Of Or |
Source: Public Records
Mortgage History
| Date | Status | Borrower | Loan Amount |
|---|---|---|---|
| Previous Owner | Montoya Martin S | $58,163 |
Source: Public Records
Tax History
| Year | Tax Paid | Tax Assessment Tax Assessment Total Assessment is a certain percentage of the fair market value that is determined by local assessors to be the total taxable value of land and additions on the property. | Land | Improvement |
|---|---|---|---|---|
| 2022 | $1,039 | $74,310 | $0 | $0 |
| 2021 | $1,042 | $72,550 | $26,000 | $46,550 |
| 2020 | $987 | $68,170 | $25,720 | $42,450 |
| 2018 | $1,127 | $74,300 | $18,930 | $55,370 |
| 2017 | $1,018 | $65,320 | $23,850 | $41,470 |
| 2016 | $996 | $61,690 | $21,130 | $40,560 |
| 2015 | $1,006 | $68,570 | $17,360 | $51,210 |
| 2014 | $1,120 | $68,570 | $17,360 | $51,210 |
Source: Public Records
Map
Nearby Homes
Your Personal Tour Guide
Ask me questions while you tour the home.