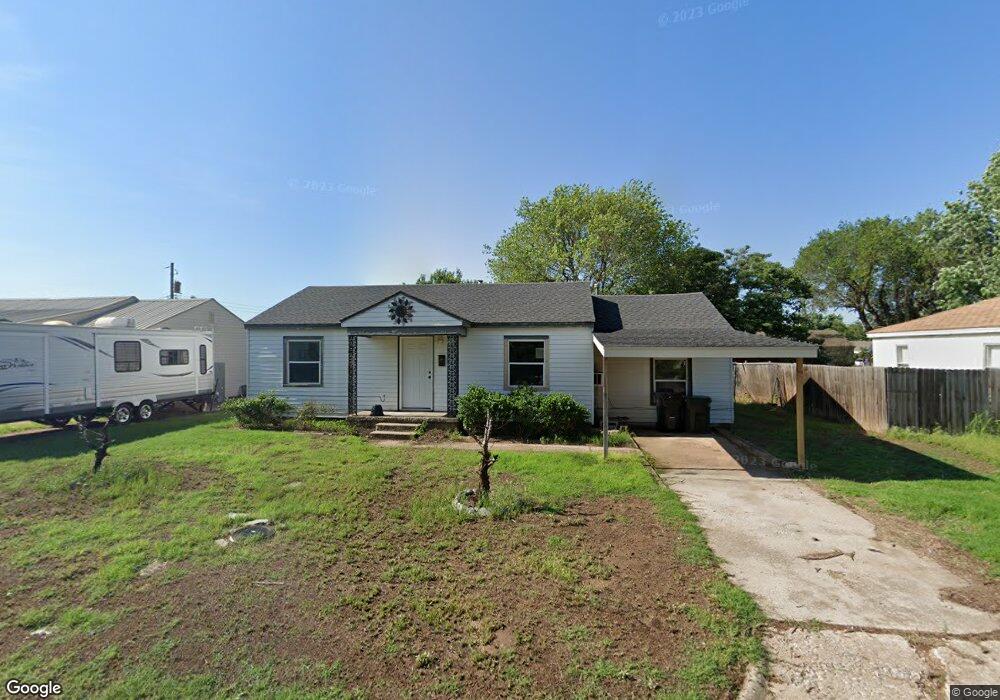
611 Circle Dr Watonga, OK 73772
Estimated Value: $65,767 - $99,000
3
Beds
1
Bath
1,078
Sq Ft
$74/Sq Ft
Est. Value
About This Home
This home is located at 611 Circle Dr, Watonga, OK 73772 and is currently estimated at $80,192, approximately $74 per square foot. 611 Circle Dr is a home located in Blaine County with nearby schools including Watonga Elementary School, Watonga Middle School, and Watonga High School.
Ownership History
Date
Name
Owned For
Owner Type
Purchase Details
Closed on
Jul 26, 2022
Sold by
Butler Iii Calvin L and Butler Amber R
Bought by
Goff Matthew and Goff Britany
Current Estimated Value
Purchase Details
Closed on
Dec 8, 2005
Sold by
Stevens Charles L and Stevens Jacquita K
Bought by
Butler Calvin L and Butler Amber R
Home Financials for this Owner
Home Financials are based on the most recent Mortgage that was taken out on this home.
Original Mortgage
$49,129
Interest Rate
6.29%
Mortgage Type
FHA
Purchase Details
Closed on
May 9, 2005
Sold by
Secretary Of Hud
Bought by
Stevens Charles and Stevens Jacquita
Purchase Details
Closed on
Dec 6, 2004
Sold by
Blaine Co Sheriff
Bought by
Secretary Of Hud
Purchase Details
Closed on
Jan 30, 1998
Sold by
Campbell James M and Campbell Jean
Bought by
Greene David Lee
Create a Home Valuation Report for This Property
The Home Valuation Report is an in-depth analysis detailing your home's value as well as a comparison with similar homes in the area
Home Values in the Area
Average Home Value in this Area
Purchase History
| Date | Buyer | Sale Price | Title Company |
|---|---|---|---|
| Goff Matthew | -- | None Listed On Document | |
| Butler Calvin L | $50,000 | None Available | |
| Stevens Charles | -- | -- | |
| Stevens Charles | -- | None Available | |
| Secretary Of Hud | -- | -- | |
| Secretary Of Hud | -- | -- | |
| Secretary Of Hud | $23,669 | None Available | |
| Greene David Lee | $25,000 | -- |
Source: Public Records
Mortgage History
| Date | Status | Borrower | Loan Amount |
|---|---|---|---|
| Previous Owner | Butler Calvin L | $49,129 |
Source: Public Records
Tax History
| Year | Tax Paid | Tax Assessment Tax Assessment Total Assessment is a certain percentage of the fair market value that is determined by local assessors to be the total taxable value of land and additions on the property. | Land | Improvement |
|---|---|---|---|---|
| 2025 | $557 | $5,390 | $503 | $4,887 |
| 2024 | $481 | $4,946 | $503 | $4,443 |
| 2023 | $458 | $4,710 | $503 | $4,207 |
| 2022 | $251 | $3,304 | $503 | $2,801 |
| 2021 | $217 | $3,208 | $503 | $2,705 |
| 2020 | $206 | $3,114 | $503 | $2,611 |
| 2019 | $201 | $3,024 | $503 | $2,521 |
| 2018 | $202 | $2,951 | $766 | $2,185 |
| 2017 | $250 | $3,349 | $247 | $3,102 |
| 2016 | $260 | $3,300 | $247 | $3,053 |
| 2015 | $233 | $3,313 | $247 | $3,066 |
| 2014 | $178 | $3,216 | $247 | $2,969 |
Source: Public Records
Map
Nearby Homes
- 632 Circle Dr
- 515 W 4th St
- 419 N Harmon Ave
- 502 W 4th St
- 415 N Harmon Ave
- 403 N Harmon Ave
- 615 & 617 N Wikoff
- 319 N Wikoff Ave
- 323 W 3rd St
- 320 W 2nd St
- 834 Mimosa Dr
- 1007 N Market Ave
- 521 N Noble Ave
- 114 N Leach Ave Unit 116 118 & 120 N Leac
- 100 W 3rd St
- 924 N Prouty Ave
- 1200 W Main St
- 1221 W Main St
- 501 Northampton Dr
- 1009 N Noble Ave
Your Personal Tour Guide
Ask me questions while you tour the home.