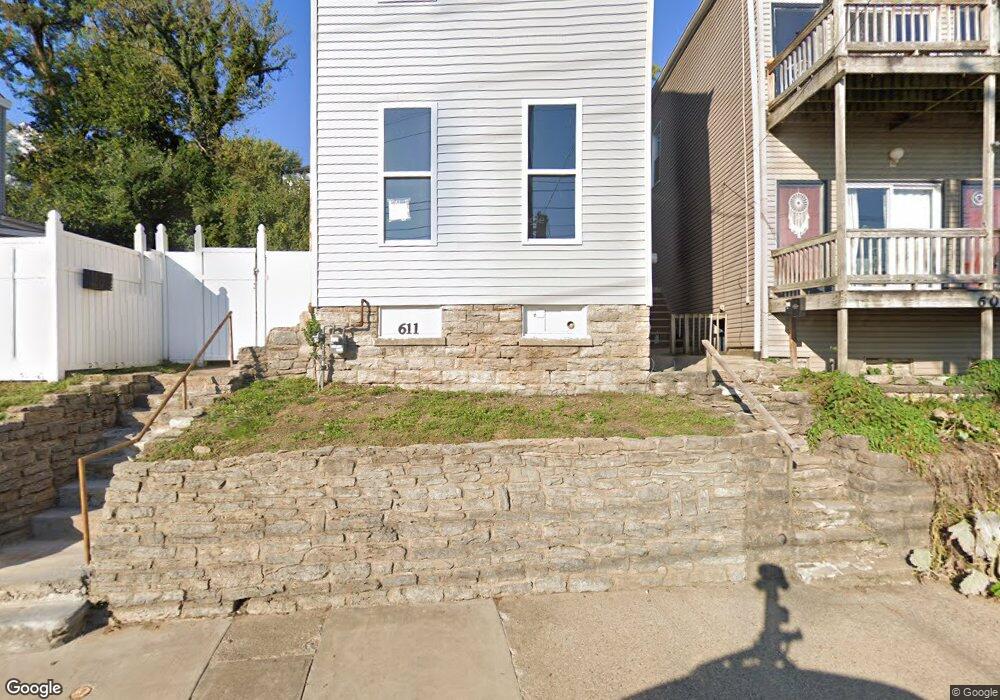
611 Crescent Ave Unit 13 Covington, KY 41011
Botany Hills NeighborhoodEstimated Value: $109,396 - $321,000
3
Beds
2
Baths
2,064
Sq Ft
$102/Sq Ft
Est. Value
About This Home
This home is located at 611 Crescent Ave Unit 13, Covington, KY 41011 and is currently estimated at $209,849, approximately $101 per square foot. 611 Crescent Ave Unit 13 is a home located in Kenton County with nearby schools including Holmes High School, Prince of Peace School, and Cincinnati Hills Christian Academy.
Ownership History
Date
Name
Owned For
Owner Type
Purchase Details
Closed on
Sep 10, 2019
Sold by
East Row Home Buyers Llc
Bought by
Rowe Thomas Matthew and Rowe Beverly Lean
Current Estimated Value
Purchase Details
Closed on
Jun 10, 2019
Sold by
Kavanaugh Sherri Marie and Kavanaugh Lisa
Bought by
East Row Home Buyers Llc
Purchase Details
Closed on
Jul 30, 2014
Sold by
Kavanaugh Sherri Marie and Hanauer Mark Richard
Bought by
Kavanaugh Sherrie Marie
Purchase Details
Closed on
Aug 27, 2003
Sold by
Kreutzjans John
Bought by
Hanauer Mark R
Home Financials for this Owner
Home Financials are based on the most recent Mortgage that was taken out on this home.
Original Mortgage
$56,900
Interest Rate
5.72%
Mortgage Type
Purchase Money Mortgage
Create a Home Valuation Report for This Property
The Home Valuation Report is an in-depth analysis detailing your home's value as well as a comparison with similar homes in the area
Home Values in the Area
Average Home Value in this Area
Purchase History
| Date | Buyer | Sale Price | Title Company |
|---|---|---|---|
| Rowe Thomas Matthew | $27,700 | Kentucky Land Title Agency | |
| East Row Home Buyers Llc | $24,000 | Stewart Title Company | |
| Kavanaugh Sherrie Marie | -- | None Available | |
| Hanauer Mark R | $59,900 | Kentucky Land Title Agency |
Source: Public Records
Mortgage History
| Date | Status | Borrower | Loan Amount |
|---|---|---|---|
| Previous Owner | Hanauer Mark R | $56,900 |
Source: Public Records
Tax History
| Year | Tax Paid | Tax Assessment Tax Assessment Total Assessment is a certain percentage of the fair market value that is determined by local assessors to be the total taxable value of land and additions on the property. | Land | Improvement |
|---|---|---|---|---|
| 2025 | $458 | $34,600 | $10,000 | $24,600 |
| 2024 | $455 | $34,600 | $10,000 | $24,600 |
| 2023 | $522 | $34,600 | $10,000 | $24,600 |
| 2022 | $523 | $34,600 | $10,000 | $24,600 |
| 2021 | $489 | $27,700 | $10,000 | $17,700 |
| 2020 | $487 | $27,700 | $10,000 | $17,700 |
| 2019 | $978 | $60,000 | $10,000 | $50,000 |
| 2018 | $997 | $60,000 | $10,000 | $50,000 |
| 2017 | $1,011 | $60,000 | $20,000 | $40,000 |
| 2015 | $1,335 | $60,000 | $20,000 | $40,000 |
| 2014 | $1,318 | $60,000 | $20,000 | $40,000 |
Source: Public Records
Map
Nearby Homes
- 652 Western Ave
- 848 Western Ave Unit Lot 2
- 844 Western Ave Unit Lot 4
- 852 Western Ave Unit Lot 1
- 846 Western Ave Unit Lot 3
- 501 Western Ave
- 728 Western Ave
- 906 Edgehill Ct
- 840 Western Ave Unit Lot 5
- 328 W 6th St
- 515 W 9th St
- 912 Virginia Ln Unit E306
- 916 Virginia Ln Unit E305
- 501 Johnson St
- 346 W 9th St
- 1194 Devou Woods
- 921-925 Spring St
- 1027 John St Unit 31
- 1031 John St
- 1027-31 John St
- 653 Crescent Ave
- 845 Crescent Ave Unit 57-58
- 0 Crescent Ave
- Lot # 3 Crescent Ave
- 609 Crescent Ave
- 609 Crescent Ave Unit 2
- 617 Crescent Ave
- 615 Crescent Ave Unit 17
- 627 Crescent Ave
- 627 Crescent Ave Unit 627
- Lot # 2 Crescent Ave
- 607 Crescent Ave
- 605 Crescent Ave
- 619 Crescent Ave
- 619 Crescent Ave Unit 623
- 621 Crescent Ave
- 623 Crescent Ave
- 601 Crescent Ave Unit 3
- 616 Western Ave
- 625 Crescent Ave