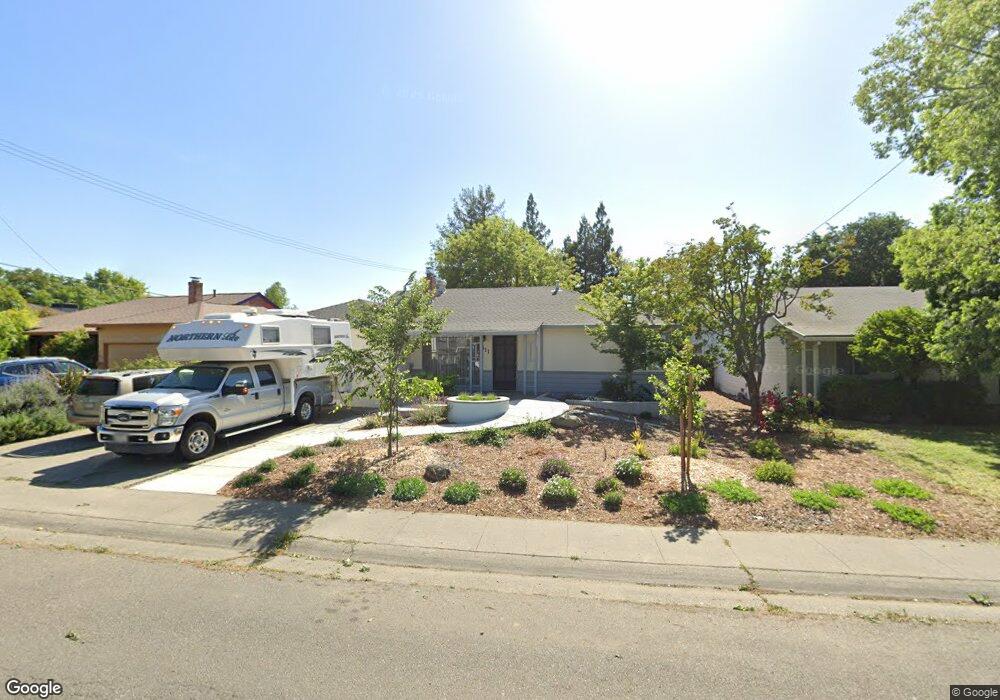
611 I St Davis, CA 95616
Central Davis NeighborhoodEstimated Value: $780,000 - $895,266
4
Beds
2
Baths
2,000
Sq Ft
$422/Sq Ft
Est. Value
About This Home
This home is located at 611 I St, Davis, CA 95616 and is currently estimated at $844,067, approximately $422 per square foot. 611 I St is a home located in Yolo County with nearby schools including North Davis Elementary School, Oliver Wendell Holmes Junior High School, and Davis Senior High School.
Ownership History
Date
Name
Owned For
Owner Type
Purchase Details
Closed on
Dec 21, 2015
Sold by
Berry Alison M and Woollard Marilyn A
Bought by
Alison M Berry & Marilyn A Woollard Trus
Current Estimated Value
Purchase Details
Closed on
May 15, 1998
Sold by
Berry Alison M and Berry Marilyn A
Bought by
Berry Alison M and Woollard Marilyn A
Home Financials for this Owner
Home Financials are based on the most recent Mortgage that was taken out on this home.
Original Mortgage
$161,600
Interest Rate
7.07%
Create a Home Valuation Report for This Property
The Home Valuation Report is an in-depth analysis detailing your home's value as well as a comparison with similar homes in the area
Home Values in the Area
Average Home Value in this Area
Purchase History
| Date | Buyer | Sale Price | Title Company |
|---|---|---|---|
| Alison M Berry & Marilyn A Woollard Trus | -- | None Available | |
| Berry Alison M | -- | North American Title Co |
Source: Public Records
Mortgage History
| Date | Status | Borrower | Loan Amount |
|---|---|---|---|
| Closed | Berry Alison M | $161,600 |
Source: Public Records
Tax History
| Year | Tax Paid | Tax Assessment Tax Assessment Total Assessment is a certain percentage of the fair market value that is determined by local assessors to be the total taxable value of land and additions on the property. | Land | Improvement |
|---|---|---|---|---|
| 2025 | $8,115 | $626,643 | $180,338 | $446,305 |
| 2023 | $8,115 | $602,311 | $173,336 | $428,975 |
| 2022 | $7,777 | $590,502 | $169,938 | $420,564 |
| 2021 | $7,595 | $578,924 | $166,606 | $412,318 |
| 2020 | $7,475 | $572,989 | $164,898 | $408,091 |
| 2019 | $7,149 | $561,755 | $161,665 | $400,090 |
| 2018 | $6,654 | $550,742 | $158,496 | $392,246 |
| 2017 | $6,515 | $539,944 | $155,389 | $384,555 |
| 2016 | $6,322 | $529,358 | $152,343 | $377,015 |
| 2015 | $6,207 | $521,407 | $150,055 | $371,352 |
| 2014 | $6,101 | $511,194 | $147,116 | $364,078 |
Source: Public Records
Map
Nearby Homes
Your Personal Tour Guide
Ask me questions while you tour the home.