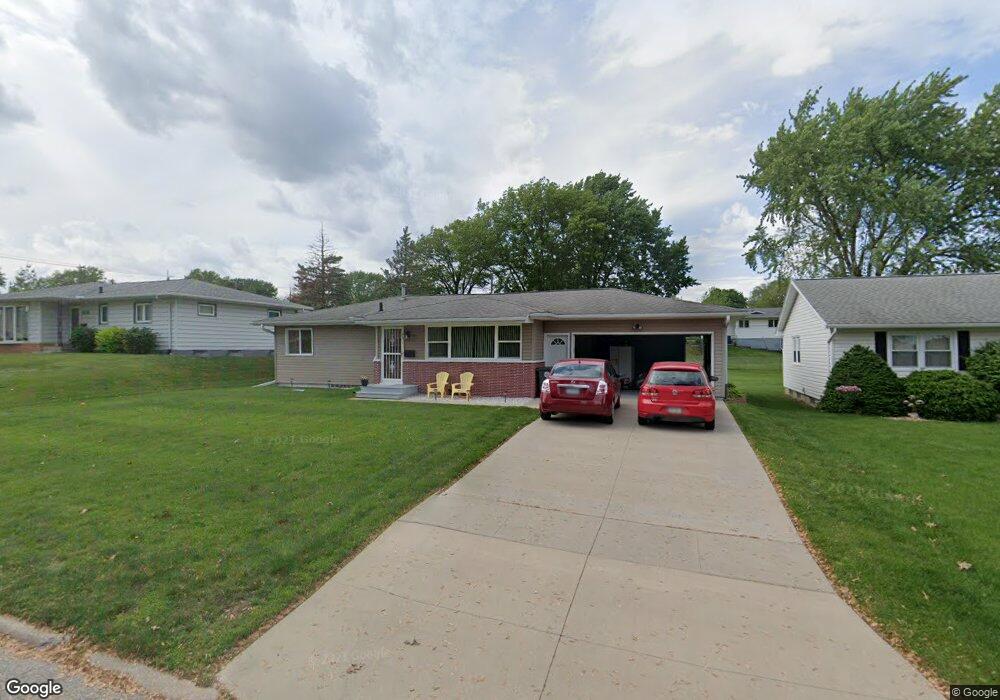
611 Locke Ave Waterloo, IA 50702
Liberty Park NeighborhoodEstimated Value: $186,000 - $195,000
3
Beds
3
Baths
1,120
Sq Ft
$170/Sq Ft
Est. Value
About This Home
This home is located at 611 Locke Ave, Waterloo, IA 50702 and is currently estimated at $190,753, approximately $170 per square foot. 611 Locke Ave is a home located in Black Hawk County with nearby schools including Kittrell Elementary School, Hoover Middle School, and West High School.
Ownership History
Date
Name
Owned For
Owner Type
Purchase Details
Closed on
Feb 21, 2012
Sold by
Bradley Zachary Nathan
Bought by
Mustedanagic Refika and Mustedanagic Ferid
Current Estimated Value
Home Financials for this Owner
Home Financials are based on the most recent Mortgage that was taken out on this home.
Original Mortgage
$117,800
Outstanding Balance
$14,265
Interest Rate
3.87%
Mortgage Type
New Conventional
Estimated Equity
$176,488
Purchase Details
Closed on
Jul 11, 2005
Sold by
Bradley Marta
Bought by
Bradley Zachary Nathan
Home Financials for this Owner
Home Financials are based on the most recent Mortgage that was taken out on this home.
Original Mortgage
$24,600
Interest Rate
5.91%
Mortgage Type
Unknown
Purchase Details
Closed on
May 17, 2005
Sold by
Clausman Christopher M and Clausman Linette M
Bought by
Bradley Zachary N and Bradley Marta
Home Financials for this Owner
Home Financials are based on the most recent Mortgage that was taken out on this home.
Original Mortgage
$24,600
Interest Rate
5.91%
Mortgage Type
Unknown
Create a Home Valuation Report for This Property
The Home Valuation Report is an in-depth analysis detailing your home's value as well as a comparison with similar homes in the area
Home Values in the Area
Average Home Value in this Area
Purchase History
| Date | Buyer | Sale Price | Title Company |
|---|---|---|---|
| Mustedanagic Refika | $123,937 | None Available | |
| Bradley Zachary Nathan | -- | None Available | |
| Bradley Zachary N | $124,000 | None Available |
Source: Public Records
Mortgage History
| Date | Status | Borrower | Loan Amount |
|---|---|---|---|
| Open | Mustedanagic Refika | $117,800 | |
| Previous Owner | Bradley Zachary N | $24,600 | |
| Previous Owner | Bradley Zachary N | $99,200 |
Source: Public Records
Tax History Compared to Growth
Tax History
| Year | Tax Paid | Tax Assessment Tax Assessment Total Assessment is a certain percentage of the fair market value that is determined by local assessors to be the total taxable value of land and additions on the property. | Land | Improvement |
|---|---|---|---|---|
| 2025 | $3,646 | $184,780 | $24,260 | $160,520 |
| 2024 | $3,646 | $168,050 | $24,260 | $143,790 |
| 2023 | $3,028 | $168,050 | $24,260 | $143,790 |
| 2022 | $2,868 | $137,890 | $24,260 | $113,630 |
| 2021 | $2,796 | $134,160 | $24,260 | $109,900 |
| 2020 | $2,752 | $123,470 | $19,060 | $104,410 |
| 2019 | $2,752 | $123,470 | $19,060 | $104,410 |
| 2018 | $2,752 | $123,470 | $19,060 | $104,410 |
| 2017 | $2,836 | $123,470 | $19,060 | $104,410 |
| 2016 | $2,802 | $123,470 | $19,060 | $104,410 |
| 2015 | $2,802 | $123,470 | $19,060 | $104,410 |
| 2014 | $2,728 | $117,970 | $19,060 | $98,910 |
Source: Public Records
Map
Nearby Homes
- 117 Lombard St
- 707 Lorraine Ave
- 814 Locke Ave
- 2204 Easley St
- 1809 Baltimore St
- 711 Cornwall Ave
- 610 Burbank Ave
- 630 Burbank Ave
- 415 Bourland Ave Unit 417
- 805 E Mitchell Ave
- 2547 W 9th St
- 922 E Mitchell Ave
- 2624 Manor St
- 1161 Easton Ave
- 710 Eureka St
- 1107 E Mitchell Ave
- 1152 Wisner Dr
- 3024 W 9th St
- 1147 Bourland Ave
- 3124 W 9th St
- 617 Locke Ave
- 605 Locke Ave
- 610 Easton Ave
- 623 Locke Ave
- 616 Easton Ave
- 624 Easton Ave
- 600 Easton Ave
- 2124 Touchae St
- 2120 Touchae St
- 630 Easton Ave
- 707 Locke Ave
- 2110 Touchae St
- 1929 Baltimore St
- 704 Easton Ave
- 713 Locke Ave
- 2132 Touchae St
- 1925 Baltimore St
- 619 Easton Ave
- 712 Easton Ave
- 703 Easton Ave