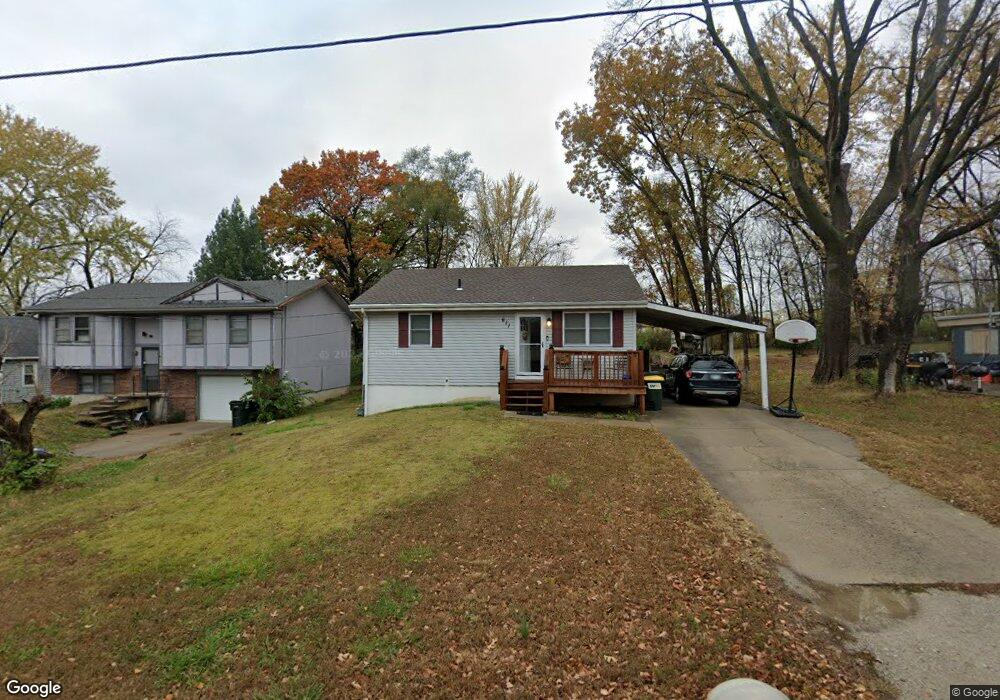
611 Morgan St Lansing, KS 66043
Estimated Value: $153,000 - $213,000
2
Beds
1
Bath
780
Sq Ft
$230/Sq Ft
Est. Value
About This Home
This home is located at 611 Morgan St, Lansing, KS 66043 and is currently estimated at $179,431, approximately $230 per square foot. 611 Morgan St is a home located in Leavenworth County with nearby schools including Lansing Elementary School, Lansing Middle 6-8, and Lansing High 9-12.
Ownership History
Date
Name
Owned For
Owner Type
Purchase Details
Closed on
Nov 10, 2020
Sold by
Duffin Sandra L
Bought by
Royal Jessica N
Current Estimated Value
Home Financials for this Owner
Home Financials are based on the most recent Mortgage that was taken out on this home.
Original Mortgage
$64,000
Outstanding Balance
$57,053
Interest Rate
2.9%
Mortgage Type
New Conventional
Estimated Equity
$122,378
Purchase Details
Closed on
Nov 9, 2020
Sold by
Duffin Sandra L
Bought by
Royal Jessica N
Home Financials for this Owner
Home Financials are based on the most recent Mortgage that was taken out on this home.
Original Mortgage
$64,000
Outstanding Balance
$57,053
Interest Rate
2.9%
Mortgage Type
New Conventional
Estimated Equity
$122,378
Purchase Details
Closed on
Mar 1, 2002
Bought by
Duffin Sandra L
Home Financials for this Owner
Home Financials are based on the most recent Mortgage that was taken out on this home.
Original Mortgage
$58,500
Interest Rate
6.8%
Mortgage Type
New Conventional
Create a Home Valuation Report for This Property
The Home Valuation Report is an in-depth analysis detailing your home's value as well as a comparison with similar homes in the area
Home Values in the Area
Average Home Value in this Area
Purchase History
| Date | Buyer | Sale Price | Title Company |
|---|---|---|---|
| Royal Jessica N | $85,120 | New Title Company Name | |
| Royal Jessica N | -- | New Title Company Name | |
| Duffin Sandra L | $79,500 | -- |
Source: Public Records
Mortgage History
| Date | Status | Borrower | Loan Amount |
|---|---|---|---|
| Open | Royal Jessica N | $64,000 | |
| Closed | Royal Jessica N | $64,000 | |
| Previous Owner | Duffin Sandra L | $58,500 | |
| Closed | Duffin Sandra L | $15,800 |
Source: Public Records
Tax History Compared to Growth
Tax History
| Year | Tax Paid | Tax Assessment Tax Assessment Total Assessment is a certain percentage of the fair market value that is determined by local assessors to be the total taxable value of land and additions on the property. | Land | Improvement |
|---|---|---|---|---|
| 2025 | $1,889 | $15,848 | $2,163 | $13,685 |
| 2024 | $1,791 | $14,811 | $2,163 | $12,648 |
| 2023 | $1,791 | $14,242 | $2,039 | $12,203 |
| 2022 | $1,723 | $12,947 | $1,780 | $11,167 |
| 2021 | $1,651 | $11,663 | $1,780 | $9,883 |
| 2020 | $1,534 | $10,680 | $1,780 | $8,900 |
| 2019 | $1,536 | $10,680 | $1,780 | $8,900 |
| 2018 | $1,393 | $9,718 | $1,780 | $7,938 |
| 2017 | $1,293 | $9,025 | $1,780 | $7,245 |
| 2016 | $1,280 | $8,935 | $1,780 | $7,155 |
| 2015 | $1,276 | $8,935 | $1,780 | $7,155 |
| 2014 | $1,250 | $8,935 | $1,780 | $7,155 |
Source: Public Records
Map
Nearby Homes
- 603 E Beth St
- 1102 N 4th St
- 1100 N 4th St
- 4 Eisenhower Rd
- 1102 N Main St
- 268 Holiday Dr
- 129 Brookwood St
- 415 Fairlane St
- 129 Crestview Ct
- 3405 Iowa St
- 63 Logan St
- 3532 Lakeview Dr
- 310 E Kansas Ave
- 4036 Shrine Park Rd
- 542 Creekside Ct
- 20958 Ida St
- 3705 Shrine Park Rd
- 306 E Kay St
- 218 E Kay St
- 4411 Garland St