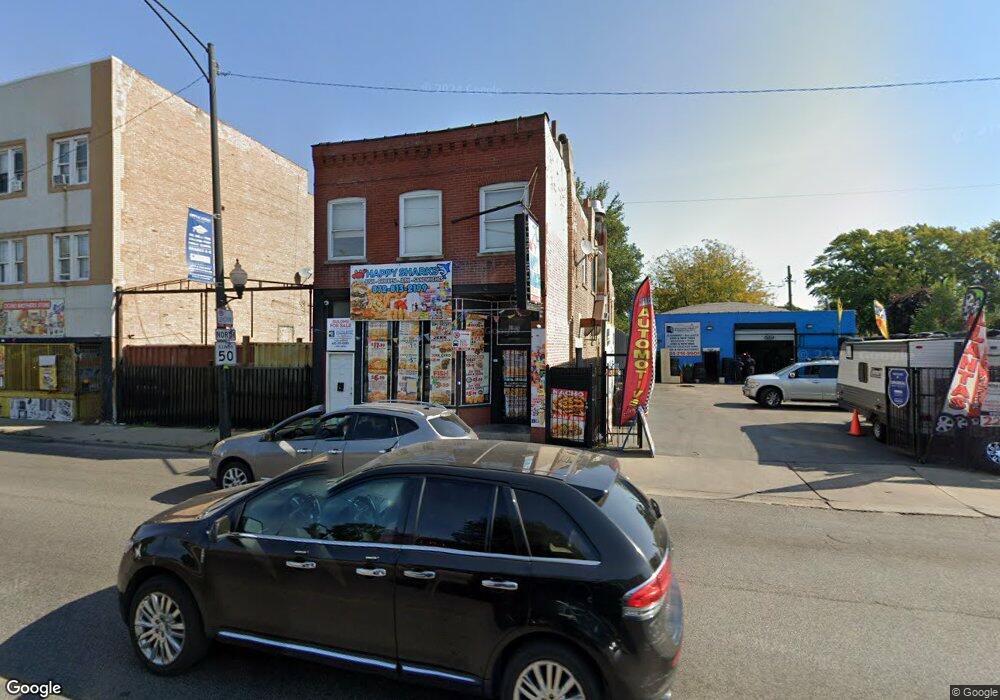
611 N Cicero Ave Chicago, IL 60644
West Humboldt Park NeighborhoodEstimated Value: $161,299 - $193,000
3
Beds
5
Baths
3,282
Sq Ft
$53/Sq Ft
Est. Value
About This Home
This home is located at 611 N Cicero Ave, Chicago, IL 60644 and is currently estimated at $172,433, approximately $52 per square foot. 611 N Cicero Ave is a home located in Cook County with nearby schools including Nash Elementary School, Marshall Metropolitan High School, and Moving Everest Charter School.
Ownership History
Date
Name
Owned For
Owner Type
Purchase Details
Closed on
Dec 20, 2024
Sold by
Daoud Ahmad and Daoud Ahmed
Bought by
Zafnat-Panea Properties Inc
Current Estimated Value
Purchase Details
Closed on
Jul 17, 2012
Sold by
Dearborn Street Holdings Llc Series 1
Bought by
Daoud Ahmed
Purchase Details
Closed on
Jan 9, 2012
Sold by
Burns Irena
Bought by
Dearborn Street Holdings Llc Series 1
Purchase Details
Closed on
Oct 13, 2005
Sold by
Masri Abdullah F
Bought by
Burns Irena W
Home Financials for this Owner
Home Financials are based on the most recent Mortgage that was taken out on this home.
Original Mortgage
$180,000
Interest Rate
6.73%
Mortgage Type
Commercial
Purchase Details
Closed on
Oct 11, 1999
Sold by
Willis Eddie and Willis Lillie
Bought by
Masri Abdullah F
Create a Home Valuation Report for This Property
The Home Valuation Report is an in-depth analysis detailing your home's value as well as a comparison with similar homes in the area
Home Values in the Area
Average Home Value in this Area
Purchase History
| Date | Buyer | Sale Price | Title Company |
|---|---|---|---|
| Zafnat-Panea Properties Inc | $158,000 | None Listed On Document | |
| Daoud Ahmed | $24,000 | Ct | |
| Dearborn Street Holdings Llc Series 1 | -- | None Available | |
| Burns Irena W | $225,000 | Atgf Inc | |
| Masri Abdullah F | $50,000 | -- |
Source: Public Records
Mortgage History
| Date | Status | Borrower | Loan Amount |
|---|---|---|---|
| Previous Owner | Burns Irena W | $180,000 |
Source: Public Records
Tax History Compared to Growth
Tax History
| Year | Tax Paid | Tax Assessment Tax Assessment Total Assessment is a certain percentage of the fair market value that is determined by local assessors to be the total taxable value of land and additions on the property. | Land | Improvement |
|---|---|---|---|---|
| 2024 | $1,514 | $16,000 | $4,604 | $11,396 |
| 2023 | $1,459 | $9,500 | $3,731 | $5,769 |
| 2022 | $1,459 | $9,500 | $3,731 | $5,769 |
| 2021 | $1,448 | $9,499 | $3,730 | $5,769 |
| 2020 | $1,986 | $10,822 | $3,730 | $7,092 |
| 2019 | $2,088 | $12,440 | $3,730 | $8,710 |
| 2018 | $2,050 | $12,440 | $3,730 | $8,710 |
| 2017 | $3,360 | $17,041 | $3,333 | $13,708 |
| 2016 | $3,334 | $17,041 | $3,333 | $13,708 |
| 2015 | $2,760 | $17,685 | $3,333 | $14,352 |
| 2014 | $2,523 | $16,166 | $3,175 | $12,991 |
| 2013 | $2,462 | $16,166 | $3,175 | $12,991 |
Source: Public Records
Map
Nearby Homes
- 4727 W Erie St
- 4839 W Huron St
- 4819 W Superior St
- 4844 W Ferdinand St
- 4925 W Erie St
- 4917 W Race Ave
- 4908 W Ferdinand St
- 4939 W Race Ave
- 4630 W Erie St
- 4954 W Huron St
- 5025 W Superior St
- 4838 W Iowa St
- 4923 W Iowa St
- 411 N Lawler Ave
- 624 N Leclaire Ave
- 4957 W Iowa St
- 4907 W Walton St
- 4918 W Fulton St
- 231 N La Crosse Ave
- 257 N Kilbourn Ave
- 611 N Cicero Ave Unit 2F
- 609 N Cicero Ave
- 607 N Cicero Ave
- 617 N Cicero Ave
- 4742 W Ohio St
- 4742 W Ohio St
- 604 N Cicero Ave
- 600 N Cicero Ave
- 4749 W Ohio St
- 4749 W Ohio St
- 4757 W Ohio St
- 4741 W Ohio St
- 633 N Cicero Ave
- 4745 W Ohio St
- 4745 W Ohio St
- 550 N Cicero Ave
- 4737 W Ohio St
- 4736 W Erie St
- 4734 W Erie St
- 632 N Cicero Ave