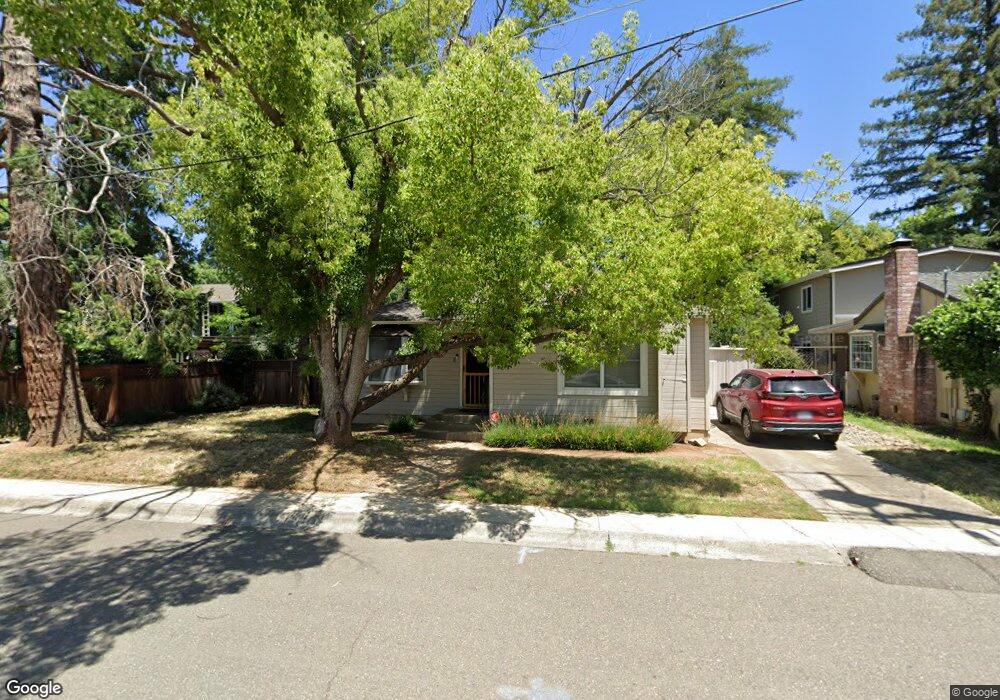
611 Orange Grove Way Folsom, CA 95630
Folsom Central NeighborhoodEstimated Value: $476,865 - $662,000
2
Beds
2
Baths
1,263
Sq Ft
$432/Sq Ft
Est. Value
About This Home
This home is located at 611 Orange Grove Way, Folsom, CA 95630 and is currently estimated at $545,966, approximately $432 per square foot. 611 Orange Grove Way is a home located in Sacramento County with nearby schools including Theodore Judah Elementary School, Sutter Middle School, and Folsom High School.
Ownership History
Date
Name
Owned For
Owner Type
Purchase Details
Closed on
Aug 15, 2016
Sold by
Smith Laurie A
Bought by
Smith Laurie A
Current Estimated Value
Home Financials for this Owner
Home Financials are based on the most recent Mortgage that was taken out on this home.
Original Mortgage
$272,000
Outstanding Balance
$216,603
Interest Rate
3.42%
Mortgage Type
New Conventional
Estimated Equity
$329,363
Purchase Details
Closed on
Dec 6, 2006
Sold by
Smith John Douglas and Smith Laurie A
Bought by
Smith Laurie A
Purchase Details
Closed on
Nov 2, 1998
Sold by
Va
Bought by
Smith John Douglas and Smith Laurie A
Home Financials for this Owner
Home Financials are based on the most recent Mortgage that was taken out on this home.
Original Mortgage
$104,250
Interest Rate
6.78%
Create a Home Valuation Report for This Property
The Home Valuation Report is an in-depth analysis detailing your home's value as well as a comparison with similar homes in the area
Home Values in the Area
Average Home Value in this Area
Purchase History
| Date | Buyer | Sale Price | Title Company |
|---|---|---|---|
| Smith Laurie A | -- | Placer Title Company | |
| Smith Laurie A | -- | None Available | |
| Smith John Douglas | -- | Chicago Title Co |
Source: Public Records
Mortgage History
| Date | Status | Borrower | Loan Amount |
|---|---|---|---|
| Open | Smith Laurie A | $272,000 | |
| Closed | Smith John Douglas | $104,250 |
Source: Public Records
Tax History Compared to Growth
Tax History
| Year | Tax Paid | Tax Assessment Tax Assessment Total Assessment is a certain percentage of the fair market value that is determined by local assessors to be the total taxable value of land and additions on the property. | Land | Improvement |
|---|---|---|---|---|
| 2025 | $1,419 | $140,020 | $22,181 | $117,839 |
| 2024 | $1,419 | $137,276 | $21,747 | $115,529 |
| 2023 | $1,393 | $134,585 | $21,321 | $113,264 |
| 2022 | $1,371 | $131,947 | $20,903 | $111,044 |
| 2021 | $1,351 | $129,361 | $20,494 | $108,867 |
| 2020 | $1,334 | $128,035 | $20,284 | $107,751 |
| 2019 | $1,310 | $125,526 | $19,887 | $105,639 |
| 2018 | $1,276 | $123,066 | $19,498 | $103,568 |
| 2017 | $1,189 | $120,654 | $19,116 | $101,538 |
| 2016 | $1,241 | $118,290 | $18,742 | $99,548 |
| 2015 | $1,198 | $116,514 | $18,461 | $98,053 |
| 2014 | $1,135 | $114,233 | $18,100 | $96,133 |
Source: Public Records
Map
Nearby Homes
- 900 Figueroa St Unit B
- 45 Diggins Dr
- 110 Lembi Dr
- 709- Persifer St
- 106 McNamee Dr
- 467 Jewel Stone Way
- 603 Figueroa St
- 901 Coloma St
- 932 Farmhouse Way
- 9709 Snowberry Way
- 408 Sutter St
- 5601 Spindrift Ln
- 692 Humbert St
- 293 Leidesdorff St
- 831 School St
- 170 Vierra Cir
- 98-98 1/2 Dean Way
- 683 Loomis Cir
- 167 Price Way
- 166 Market St
- 705 Orange Grove Way (Back
- 705 Orange Grove Way
- 609 Orange Grove Way
- 607 Orange Grove Way
- 612 Orange Grove Way
- 707 Orange Grove Way
- 630 Sibley St
- 610 Orange Grove Way
- 706 Orange Grove Way
- 702 Sibley St
- 612 Sibley St
- 610 Sibley St
- 608 Orange Grove Way
- 708 Orange Grove Way
- 706 Sibley St
- 709 Orange Grove Way
- 603 Orange Grove Way
- 608 Sibley St
- 710 Sibley St
- 710 Orange Grove Way