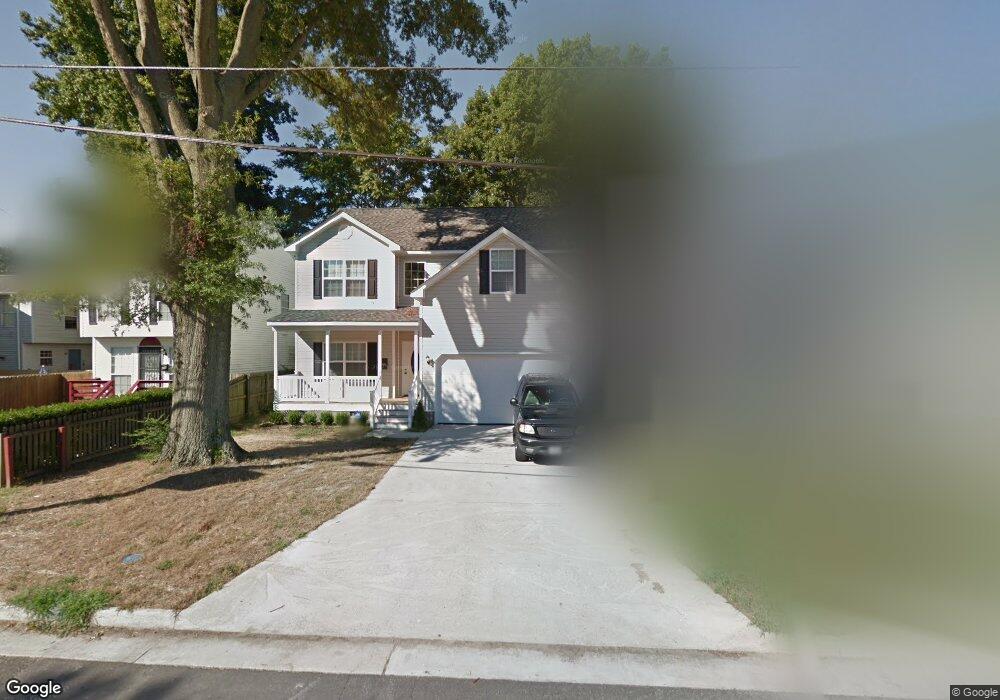
611 Ridgeway Ave Hampton, VA 23661
Wythe NeighborhoodEstimated Value: $372,282 - $405,000
4
Beds
3
Baths
2,425
Sq Ft
$161/Sq Ft
Est. Value
About This Home
This home is located at 611 Ridgeway Ave, Hampton, VA 23661 and is currently estimated at $390,571, approximately $161 per square foot. 611 Ridgeway Ave is a home located in Hampton City with nearby schools including Bassette Elementary School, C. Alton Lindsay Middle School, and Hampton High School.
Ownership History
Date
Name
Owned For
Owner Type
Purchase Details
Closed on
Jan 30, 2015
Sold by
Stm Properties Inc
Bought by
Drummond Lucky D
Current Estimated Value
Home Financials for this Owner
Home Financials are based on the most recent Mortgage that was taken out on this home.
Original Mortgage
$235,554
Outstanding Balance
$180,350
Interest Rate
3.75%
Mortgage Type
FHA
Estimated Equity
$210,221
Purchase Details
Closed on
Apr 22, 2014
Sold by
Generation Mortgage Company
Bought by
Stm Properties Inc
Home Financials for this Owner
Home Financials are based on the most recent Mortgage that was taken out on this home.
Original Mortgage
$18,487
Interest Rate
4.27%
Mortgage Type
New Conventional
Purchase Details
Closed on
Feb 25, 2014
Sold by
Commonwealth Asset Svcs Llc and Jenkins Ethel M
Bought by
Generation Mortgage Company
Home Financials for this Owner
Home Financials are based on the most recent Mortgage that was taken out on this home.
Original Mortgage
$18,487
Interest Rate
4.27%
Mortgage Type
New Conventional
Create a Home Valuation Report for This Property
The Home Valuation Report is an in-depth analysis detailing your home's value as well as a comparison with similar homes in the area
Home Values in the Area
Average Home Value in this Area
Purchase History
| Date | Buyer | Sale Price | Title Company |
|---|---|---|---|
| Drummond Lucky D | $239,900 | -- | |
| Stm Properties Inc | $35,000 | -- | |
| Generation Mortgage Company | $36,000 | -- |
Source: Public Records
Mortgage History
| Date | Status | Borrower | Loan Amount |
|---|---|---|---|
| Open | Drummond Lucky D | $235,554 | |
| Closed | Drummond Lucky D | $8,396 | |
| Previous Owner | Stm Properties Inc | $18,487 |
Source: Public Records
Tax History
| Year | Tax Paid | Tax Assessment Tax Assessment Total Assessment is a certain percentage of the fair market value that is determined by local assessors to be the total taxable value of land and additions on the property. | Land | Improvement |
|---|---|---|---|---|
| 2025 | $4,788 | $374,700 | $42,500 | $332,200 |
| 2024 | $5,008 | $435,500 | $42,500 | $393,000 |
| 2023 | $4,337 | $373,900 | $42,500 | $331,400 |
| 2022 | $3,826 | $324,200 | $37,500 | $286,700 |
| 2021 | $3,789 | $295,100 | $32,500 | $262,600 |
| 2020 | $2,962 | $238,900 | $32,400 | $206,500 |
| 2019 | $2,962 | $238,900 | $32,400 | $206,500 |
| 2018 | $3,017 | $235,700 | $29,200 | $206,500 |
| 2017 | $3,017 | $0 | $0 | $0 |
| 2016 | $3,017 | $235,700 | $0 | $0 |
| 2015 | $3,017 | $0 | $0 | $0 |
Source: Public Records
Map
Nearby Homes
- 632 Westwood Ave
- 621 Fairland Ave
- 615 Westwood Ave
- 3213 Shell Rd
- 812 Ridgeway Ave
- 438 Highland Ave
- 714 Milford Ave
- 429 Shenandoah Rd
- 423 Shenandoah Rd
- 814 Downing St
- 428 Colonial Ave
- 914 Ridgeway Ave
- 919 Ridgeway Ave
- 405 Seminole Rd
- 816 Smith St
- 3818 Shell Rd
- 625 Bell St
- 633 Bell St
- 2711 Shell Rd
- 8 Roundtree Cir
- 615 Ridgeway Ave
- 609 Ridgeway Ave
- 631 Ridgeway Ave
- 616 Westwood Ave
- 3413 Shell Rd
- 3411 Shell Rd
- 612 Westwood Ave
- 3415 Shell Rd
- 3409 Shell Rd
- 620 Westwood Ave
- 622 Westwood Ave
- 622 Westwood Ave Unit AVE
- 3407 Shell Rd
- 3405 Shell Rd
- 633 Ridgeway Ave
- 624 Westwood Ave
- 618 Ridgeway Ave
- 608 Ridgeway Ave
- 610 Ridgeway Ave
- 3403 Shell Rd
Your Personal Tour Guide
Ask me questions while you tour the home.