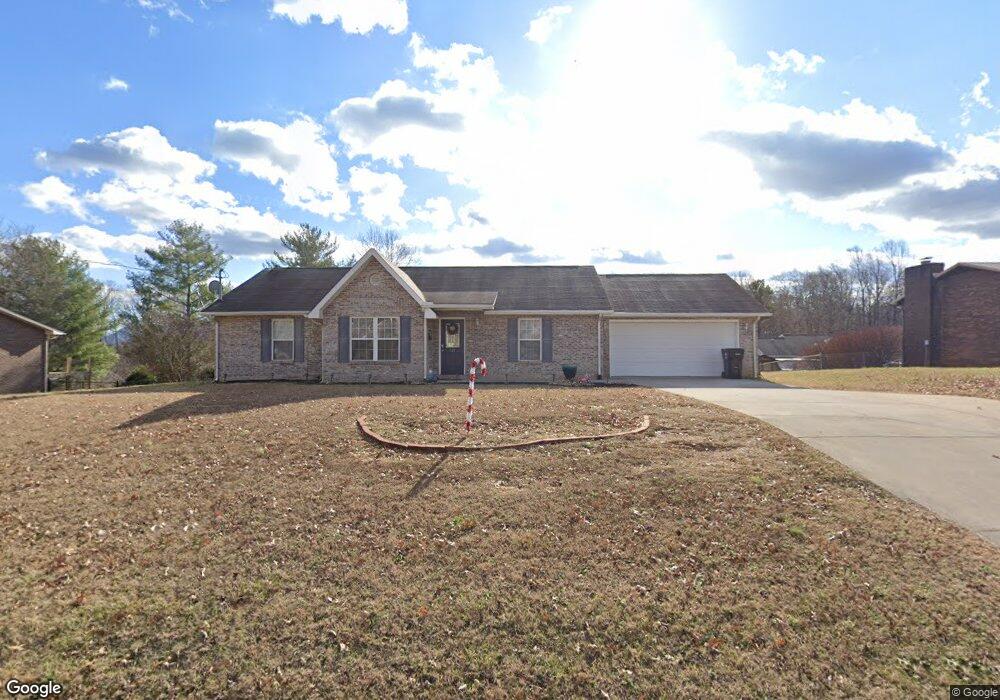
611 Valley View St Seymour, TN 37865
Estimated Value: $303,904 - $360,000
3
Beds
2
Baths
1,336
Sq Ft
$248/Sq Ft
Est. Value
About This Home
This home is located at 611 Valley View St, Seymour, TN 37865 and is currently estimated at $331,952, approximately $248 per square foot. 611 Valley View St is a home located in Sevier County with nearby schools including Northview Elementary School, Catons Chapel Elementary School, and Jones Cove Elementary School.
Ownership History
Date
Name
Owned For
Owner Type
Purchase Details
Closed on
Nov 4, 2016
Sold by
Rogers Edwin T
Bought by
Rogers Edwin T and Rogers John Richard
Current Estimated Value
Home Financials for this Owner
Home Financials are based on the most recent Mortgage that was taken out on this home.
Original Mortgage
$147,913
Interest Rate
3.46%
Mortgage Type
New Conventional
Purchase Details
Closed on
Sep 30, 2016
Sold by
Sales Camilo
Bought by
Rogers Edwin T
Home Financials for this Owner
Home Financials are based on the most recent Mortgage that was taken out on this home.
Original Mortgage
$147,913
Interest Rate
3.46%
Mortgage Type
New Conventional
Purchase Details
Closed on
Mar 20, 2006
Sold by
Poplawski Gary
Bought by
Sales Camilo
Purchase Details
Closed on
Apr 28, 2004
Bought by
Poplawski Gary and Poplawski Robyn
Purchase Details
Closed on
Nov 30, 1998
Bought by
Brewster Brenda and Brewster Ernest L
Create a Home Valuation Report for This Property
The Home Valuation Report is an in-depth analysis detailing your home's value as well as a comparison with similar homes in the area
Home Values in the Area
Average Home Value in this Area
Purchase History
| Date | Buyer | Sale Price | Title Company |
|---|---|---|---|
| Rogers Edwin T | -- | -- | |
| Rogers Edwin T | $144,800 | -- | |
| Sales Camilo | $138,000 | -- | |
| Poplawski Gary | $17,500 | -- | |
| Brewster Brenda | $124,500 | -- |
Source: Public Records
Mortgage History
| Date | Status | Borrower | Loan Amount |
|---|---|---|---|
| Previous Owner | Rogers Edwin T | $147,913 |
Source: Public Records
Tax History Compared to Growth
Tax History
| Year | Tax Paid | Tax Assessment Tax Assessment Total Assessment is a certain percentage of the fair market value that is determined by local assessors to be the total taxable value of land and additions on the property. | Land | Improvement |
|---|---|---|---|---|
| 2025 | $623 | $42,125 | $7,500 | $34,625 |
| 2024 | $623 | $42,125 | $7,500 | $34,625 |
| 2023 | $623 | $42,125 | $0 | $0 |
| 2022 | $623 | $42,125 | $7,500 | $34,625 |
| 2021 | $623 | $42,125 | $7,500 | $34,625 |
| 2020 | $664 | $42,125 | $7,500 | $34,625 |
| 2019 | $664 | $35,700 | $7,975 | $27,725 |
| 2018 | $664 | $35,700 | $7,975 | $27,725 |
| 2017 | $664 | $35,700 | $7,975 | $27,725 |
| 2016 | $664 | $35,700 | $7,975 | $27,725 |
| 2015 | -- | $35,625 | $0 | $0 |
| 2014 | $581 | $35,626 | $0 | $0 |
Source: Public Records
Map
Nearby Homes
- 536 Keck St
- 521 Devon St
- 516 Keck St
- 534 Tennessee Cir
- 0 Burns Ln
- 116 Blue Ridge Ln
- 401 Burns Ln
- 5925 Sevierville Rd
- 205 Blue Ridge Ln
- 830 Easey St
- 237 Westmoreland Ct
- 648 Emerald Ave
- 325 Blue Ridge Ln
- 634 Crestview Ct
- 755 Whippoorwill Cir
- 217 Bar Tall Way
- 203 Bar Tall Way
- 123 Colonial Cir
- 309 Franklin Meadows Way
- 802 Hinkle Rd
- 619 Valley View St
- 607 Valley View St
- 628 Miller Cir
- 616 Valley View St
- 632 Miller Cir
- 624 Miller Cir
- 625 Valley View St
- 603 Valley View St
- 622 Valley View St
- 606 Valley View St
- 646 Miller Cir
- 620 Miller Cir
- 626 Valley View St
- 617 Devon St
- 602 Valley View St
- 623 Devon St
- 607 Devon St
- 650 Miller Cir
- 563 Valley View St
- 627 Devon St