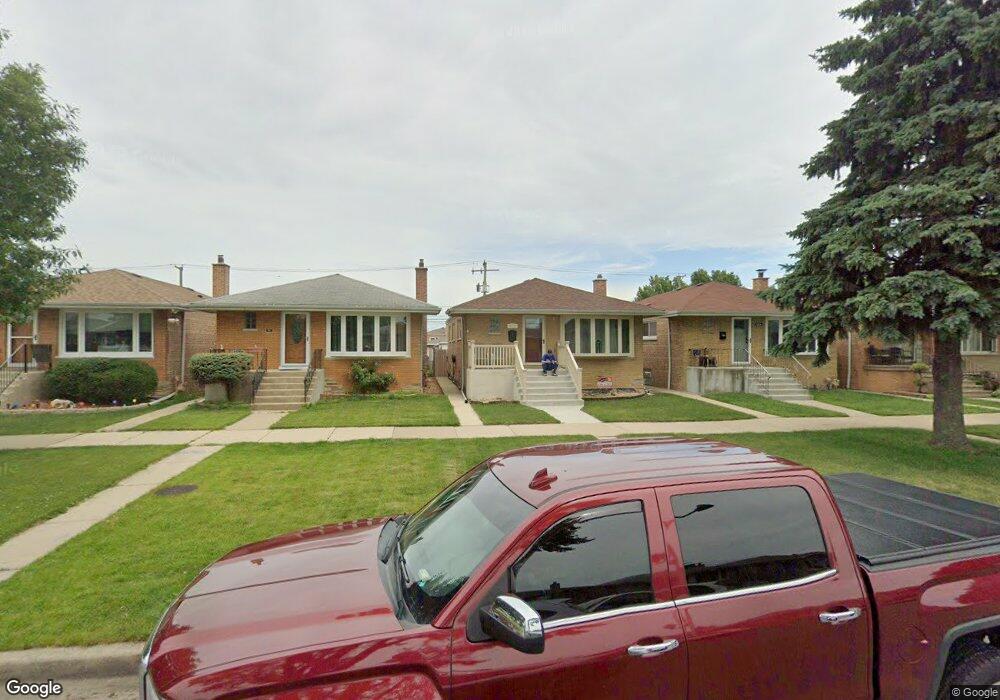
6110 W 63rd Place Chicago, IL 60638
Clearing NeighborhoodEstimated Value: $316,000 - $343,097
3
Beds
2
Baths
1,099
Sq Ft
$300/Sq Ft
Est. Value
About This Home
This home is located at 6110 W 63rd Place, Chicago, IL 60638 and is currently estimated at $329,524, approximately $299 per square foot. 6110 W 63rd Place is a home located in Cook County with nearby schools including Hale Elementary School, Kennedy High School, and St. Symphorosa Catholic School.
Ownership History
Date
Name
Owned For
Owner Type
Purchase Details
Closed on
Dec 12, 2007
Sold by
Porcelli Frank and Porcelli Sarah
Bought by
White Eric and White Melissa
Current Estimated Value
Home Financials for this Owner
Home Financials are based on the most recent Mortgage that was taken out on this home.
Original Mortgage
$231,369
Outstanding Balance
$143,775
Interest Rate
5.95%
Mortgage Type
FHA
Estimated Equity
$185,749
Purchase Details
Closed on
Jul 13, 2004
Sold by
Grzywacz Boleslaw and Grzywacz Stanislawa
Bought by
Porcelli Frank
Home Financials for this Owner
Home Financials are based on the most recent Mortgage that was taken out on this home.
Original Mortgage
$211,650
Interest Rate
6.35%
Mortgage Type
Unknown
Purchase Details
Closed on
May 16, 1995
Sold by
Hedderman Michael J and Hedderman Mary Ann C
Bought by
Erdman James F and Erdman Kristen M
Home Financials for this Owner
Home Financials are based on the most recent Mortgage that was taken out on this home.
Original Mortgage
$113,400
Interest Rate
7.9%
Create a Home Valuation Report for This Property
The Home Valuation Report is an in-depth analysis detailing your home's value as well as a comparison with similar homes in the area
Home Values in the Area
Average Home Value in this Area
Purchase History
| Date | Buyer | Sale Price | Title Company |
|---|---|---|---|
| White Eric | $235,000 | Cti | |
| Porcelli Frank | $249,000 | Pntn | |
| Erdman James F | $126,000 | -- |
Source: Public Records
Mortgage History
| Date | Status | Borrower | Loan Amount |
|---|---|---|---|
| Open | White Eric | $231,369 | |
| Previous Owner | Porcelli Frank | $211,650 | |
| Previous Owner | Erdman James F | $113,400 |
Source: Public Records
Tax History Compared to Growth
Tax History
| Year | Tax Paid | Tax Assessment Tax Assessment Total Assessment is a certain percentage of the fair market value that is determined by local assessors to be the total taxable value of land and additions on the property. | Land | Improvement |
|---|---|---|---|---|
| 2024 | $3,964 | $28,000 | $4,914 | $23,086 |
| 2023 | $3,843 | $22,001 | $4,388 | $17,613 |
| 2022 | $3,843 | $22,001 | $4,388 | $17,613 |
| 2021 | $3,754 | $21,999 | $4,387 | $17,612 |
| 2020 | $3,635 | $19,314 | $3,510 | $15,804 |
| 2019 | $3,646 | $21,461 | $3,510 | $17,951 |
| 2018 | $3,584 | $21,461 | $3,510 | $17,951 |
| 2017 | $3,361 | $18,884 | $3,159 | $15,725 |
| 2016 | $3,304 | $18,884 | $3,159 | $15,725 |
| 2015 | $3,001 | $18,884 | $3,159 | $15,725 |
| 2014 | $2,670 | $16,849 | $2,983 | $13,866 |
| 2013 | $2,607 | $16,849 | $2,983 | $13,866 |
Source: Public Records
Map
Nearby Homes
- 6054 W 64th St
- 7754 S Mcvicker Ave
- 6154 W 63rd St Unit 3W
- 6209 W 63rd Place
- 6220 S Mcvicker Ave
- 6201 S Meade Ave
- 6204 S Mcvicker Ave
- 6339 S Austin Ave
- 6120 W 65th St Unit 5
- 6152 S Austin Ave
- 6322 W 63rd Place
- 6359 W 63rd Place
- 6046 S Melvina Ave
- 5817 W 64th St
- 6416 W 64th Place Unit 3A
- 6004 S Moody Ave
- 6037 S Mason Ave
- 6430 W 64th Place
- 6109 S Monitor Ave
- 6158 W 60th St Unit 10
- 6112 W 63rd Place
- 6106 W 63rd Place
- 6104 W 63rd Place
- 6116 W 63rd Place
- 6100 W 63rd Place
- 6118 W 63rd Place
- 6122 W 63rd Place
- 6111 W 63rd St
- 6115 W 63rd St
- 6107 W 63rd St
- 6117 W 63rd St
- 6105 W 63rd St
- 6124 W 63rd Place
- 6101 W 63rd St
- 6119 W 63rd St
- 6121 W 63rd St
- 6123 W 63rd St
- 6058 W 63rd Place
- 6115 W 63rd Place