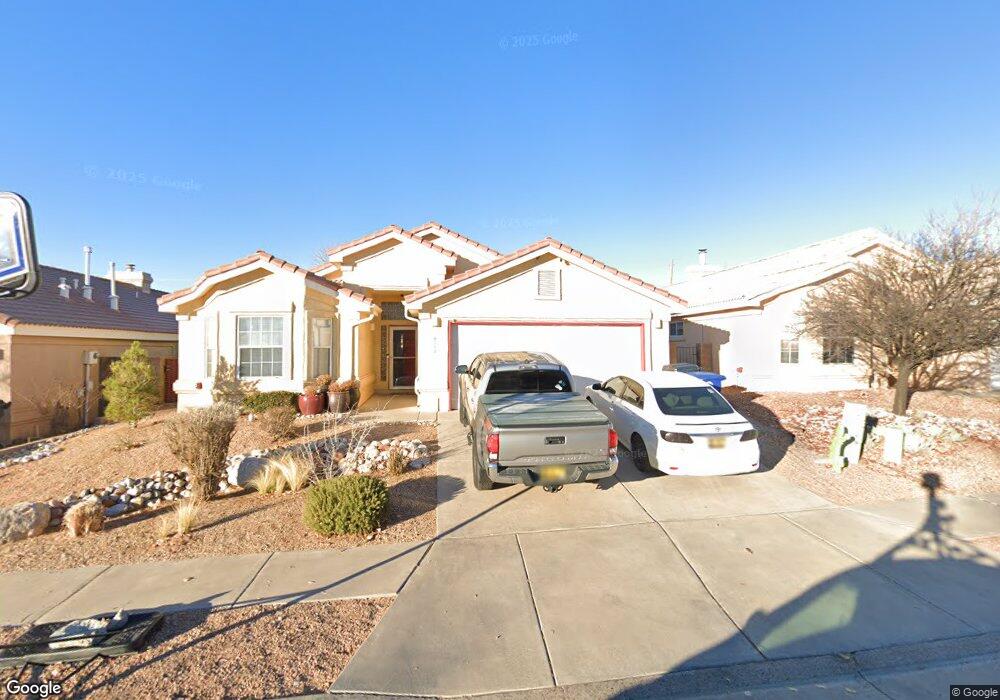
6115 Black Ridge Dr NW Albuquerque, NM 87120
Taylor Ranch NeighborhoodEstimated Value: $329,000 - $380,000
3
Beds
2
Baths
1,750
Sq Ft
$204/Sq Ft
Est. Value
About This Home
This home is located at 6115 Black Ridge Dr NW, Albuquerque, NM 87120 and is currently estimated at $357,774, approximately $204 per square foot. 6115 Black Ridge Dr NW is a home located in Bernalillo County with nearby schools including Marie M. Hughes Elementary School, L.B. Johnson Middle School, and Volcano Vista High School.
Ownership History
Date
Name
Owned For
Owner Type
Purchase Details
Closed on
Oct 8, 2024
Sold by
Rdj Investments Llc
Bought by
1601 Georgia Llc
Current Estimated Value
Purchase Details
Closed on
Mar 24, 2004
Sold by
Forshage Alex B and Forshage Elizabeth
Bought by
Fitak Jason R and Mcdavid Fitak Janet L
Home Financials for this Owner
Home Financials are based on the most recent Mortgage that was taken out on this home.
Original Mortgage
$148,675
Interest Rate
5.64%
Mortgage Type
Purchase Money Mortgage
Purchase Details
Closed on
Oct 27, 1998
Sold by
Forshage A Blaine
Bought by
Forshage Alex B and Forshage Elizabeth
Home Financials for this Owner
Home Financials are based on the most recent Mortgage that was taken out on this home.
Original Mortgage
$152,157
Interest Rate
6.61%
Mortgage Type
VA
Create a Home Valuation Report for This Property
The Home Valuation Report is an in-depth analysis detailing your home's value as well as a comparison with similar homes in the area
Home Values in the Area
Average Home Value in this Area
Purchase History
| Date | Buyer | Sale Price | Title Company |
|---|---|---|---|
| 1601 Georgia Llc | -- | None Listed On Document | |
| 1601 Georgia Llc | -- | None Listed On Document | |
| Fitak Jason R | -- | Fidelity Natl Title Ins Co | |
| Forshage Alex B | -- | Stewart Title |
Source: Public Records
Mortgage History
| Date | Status | Borrower | Loan Amount |
|---|---|---|---|
| Previous Owner | Fitak Jason R | $148,675 | |
| Previous Owner | Forshage Alex B | $152,157 |
Source: Public Records
Tax History Compared to Growth
Tax History
| Year | Tax Paid | Tax Assessment Tax Assessment Total Assessment is a certain percentage of the fair market value that is determined by local assessors to be the total taxable value of land and additions on the property. | Land | Improvement |
|---|---|---|---|---|
| 2025 | $2,780 | $69,935 | $15,764 | $54,171 |
| 2024 | $2,780 | $67,898 | $15,305 | $52,593 |
| 2023 | $2,732 | $65,921 | $14,859 | $51,062 |
| 2022 | $2,637 | $64,001 | $14,427 | $49,574 |
| 2021 | $2,546 | $62,138 | $14,007 | $48,131 |
| 2020 | $2,502 | $60,328 | $13,599 | $46,729 |
| 2019 | $2,523 | $60,828 | $13,599 | $47,229 |
| 2018 | $2,456 | $60,828 | $13,599 | $47,229 |
| 2017 | $2,378 | $59,656 | $14,859 | $44,797 |
| 2016 | $2,307 | $56,233 | $14,007 | $42,226 |
| 2015 | $54,595 | $54,595 | $13,599 | $40,996 |
| 2014 | $2,233 | $54,595 | $13,599 | $40,996 |
| 2013 | -- | $55,028 | $13,599 | $41,429 |
Source: Public Records
Map
Nearby Homes
- 0 Santo Domingo St NW Unit 1072927
- 6020 Jamers Place NW
- 7904 Marigold Dr NW
- 6427 Pojoaque Dr NW
- 6200 Marigold Ct NW
- 6420 Pojoaque Rd NW
- 6101 Chimayo Dr NW
- 8009 Marigold Dr NW
- 5901 Chimayo Dr NW
- 5805 Chimayo Dr NW
- 0 Unser Blvd NW
- 6705 Lamar Ave NW
- 8027 Monte Carlo Dr
- 6304 Flor Del Sol Place NW
- 6116 Agate Ave NW
- 6133 Flor de Mayo Place NW
- 6720 Lamar Ave NW
- 7908 Mauna Loa Dr NW
- 7805 Aguila St NW
- 6605 Rim Rock Cir NW
- 6119 Black Ridge Dr NW
- 6109 Black Ridge Dr NW
- 6105 Black Ridge Dr NW
- 6201 Black Ridge Dr NW
- 6116 Black Ridge Dr NW
- 6112 Black Ridge Dr NW
- 6101 Black Ridge Dr NW
- 6205 Black Ridge Dr NW
- 6120 Black Ridge Dr NW
- 6200 Black Ridge Dr NW
- 6435 Kochis Rd NW
- 6039 Black Ridge Dr NW
- 6204 Black Ridge Dr NW
- 6209 Black Ridge Dr NW
- 6431 Kochis Rd NW
- 6209 Whisper Ridge Dr NW
- 6208 Black Ridge Dr NW
- 6205 Whisper Ridge Dr NW
- 6215 Black Ridge Dr NW
- 6035 Black Ridge Dr NW