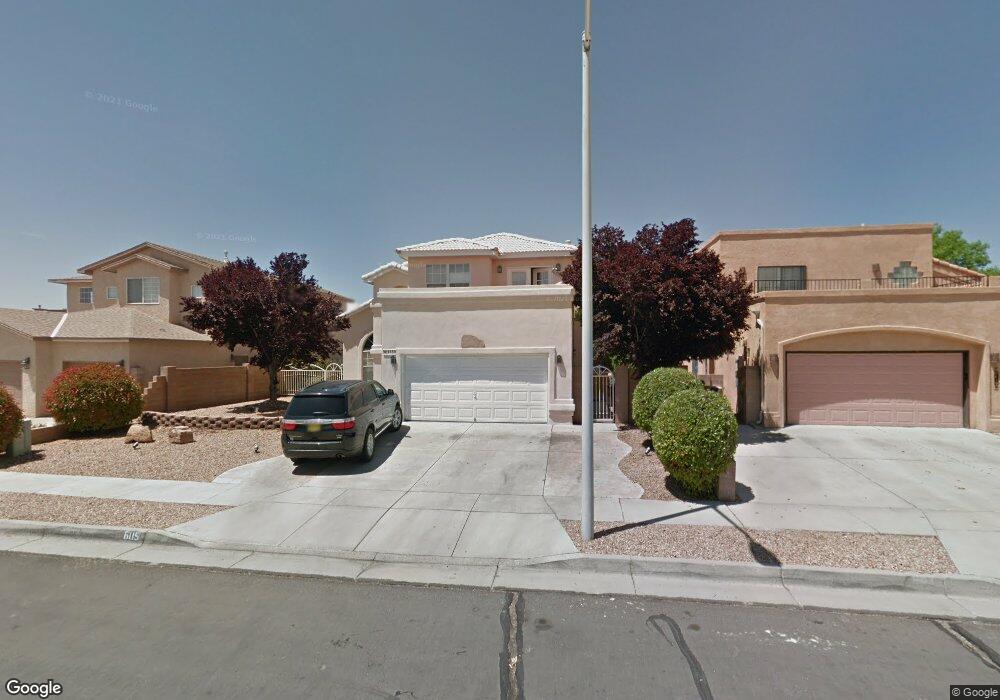
6115 Cochiti Dr NW Albuquerque, NM 87120
Taylor Ranch NeighborhoodEstimated Value: $357,000 - $473,000
3
Beds
3
Baths
2,065
Sq Ft
$192/Sq Ft
Est. Value
About This Home
This home is located at 6115 Cochiti Dr NW, Albuquerque, NM 87120 and is currently estimated at $396,309, approximately $191 per square foot. 6115 Cochiti Dr NW is a home located in Bernalillo County with nearby schools including Marie M. Hughes Elementary School, L.B. Johnson Middle School, and Volcano Vista High School.
Ownership History
Date
Name
Owned For
Owner Type
Purchase Details
Closed on
Aug 13, 2025
Sold by
Lee Wyman
Bought by
Lee Wyman and Lee Belinda
Current Estimated Value
Home Financials for this Owner
Home Financials are based on the most recent Mortgage that was taken out on this home.
Original Mortgage
$228,937
Outstanding Balance
$228,739
Interest Rate
6.72%
Mortgage Type
FHA
Estimated Equity
$167,570
Purchase Details
Closed on
Jul 27, 2005
Sold by
Chavez Daniel R and Chavez Fabiola
Bought by
Lee Wyman and Lee Belinda
Home Financials for this Owner
Home Financials are based on the most recent Mortgage that was taken out on this home.
Original Mortgage
$207,200
Interest Rate
7.35%
Mortgage Type
Fannie Mae Freddie Mac
Purchase Details
Closed on
May 13, 1999
Sold by
Meyer Lee J and Meyer Elizabeth K
Bought by
Chavez Daniel R and Chavez Fabiola
Home Financials for this Owner
Home Financials are based on the most recent Mortgage that was taken out on this home.
Original Mortgage
$144,000
Interest Rate
8%
Create a Home Valuation Report for This Property
The Home Valuation Report is an in-depth analysis detailing your home's value as well as a comparison with similar homes in the area
Home Values in the Area
Average Home Value in this Area
Purchase History
| Date | Buyer | Sale Price | Title Company |
|---|---|---|---|
| Lee Wyman | -- | Fidelity National Title | |
| Lee Wyman | -- | Atc | |
| Chavez Daniel R | $159,000 | First American Title Co |
Source: Public Records
Mortgage History
| Date | Status | Borrower | Loan Amount |
|---|---|---|---|
| Open | Lee Wyman | $228,937 | |
| Previous Owner | Lee Wyman | $207,200 | |
| Previous Owner | Chavez Daniel R | $144,000 |
Source: Public Records
Tax History Compared to Growth
Tax History
| Year | Tax Paid | Tax Assessment Tax Assessment Total Assessment is a certain percentage of the fair market value that is determined by local assessors to be the total taxable value of land and additions on the property. | Land | Improvement |
|---|---|---|---|---|
| 2025 | $3,238 | $79,053 | $17,425 | $61,628 |
| 2024 | $3,238 | $76,751 | $16,918 | $59,833 |
| 2023 | $3,184 | $74,516 | $16,425 | $58,091 |
| 2022 | $3,077 | $72,346 | $15,947 | $56,399 |
| 2021 | $2,974 | $70,239 | $15,483 | $54,756 |
| 2020 | $2,925 | $68,193 | $15,032 | $53,161 |
| 2019 | $2,924 | $68,193 | $15,032 | $53,161 |
| 2018 | $2,875 | $68,193 | $15,032 | $53,161 |
| 2017 | $2,786 | $67,487 | $16,425 | $51,062 |
| 2016 | $2,706 | $63,614 | $15,483 | $48,131 |
| 2015 | $61,761 | $61,761 | $15,032 | $46,729 |
| 2014 | $2,644 | $62,261 | $15,032 | $47,229 |
| 2013 | -- | $62,261 | $15,032 | $47,229 |
Source: Public Records
Map
Nearby Homes
- 6101 Chimayo Dr NW
- 5901 Chimayo Dr NW
- 5805 Chimayo Dr NW
- 6420 Pojoaque Rd NW
- 6133 Flor de Mayo Place NW
- 6005 Rio Pueblo Dr NW
- 6116 Agate Ave NW
- 6616 Meadow Lake Place NW
- 6020 Jamers Place NW
- 5504 Hayes Dr NW
- 0 Santo Domingo St NW Unit 1072927
- 5305 Desert Sand Place NW
- 6304 Flor Del Sol Place NW
- 5609 Cambria Rd NW
- 0 Unser Blvd NW
- 6012 Open Sky Dr NW
- 5432 Mariposa Dr NW
- 5429 Gold Rush Dr NW
- 5404 Territorial Rd NW
- 5143 Gaviota NW
- 6119 Cochiti Dr NW
- 6109 Cochiti Dr NW
- 6116 Sweetwater Dr NW
- 6120 Sweetwater Dr NW
- 6108 Sweetwater Dr NW
- 6105 Cochiti Dr NW
- 6201 Cochiti Dr NW
- 6200 Sweetwater Dr NW
- 6104 Sweetwater Dr NW
- 6028 Bear Claw Rd NW
- 6101 Cochiti Dr NW
- 6205 Cochiti Dr NW
- 6204 Sweetwater Dr NW
- 6024 Bear Claw Rd NW
- 6029 Kiva St NW
- 6209 Cochiti Dr NW
- 6115 Sweetwater Dr NW
- 6119 Sweetwater Dr NW
- 6025 Kiva St NW
- 6020 Bear Claw Rd NW