6116 Daft St Lansing, MI 48911
Southern Lansing NeighborhoodEstimated Value: $130,517 - $164,000
Studio
--
Bath
1,074
Sq Ft
$130/Sq Ft
Est. Value
About This Home
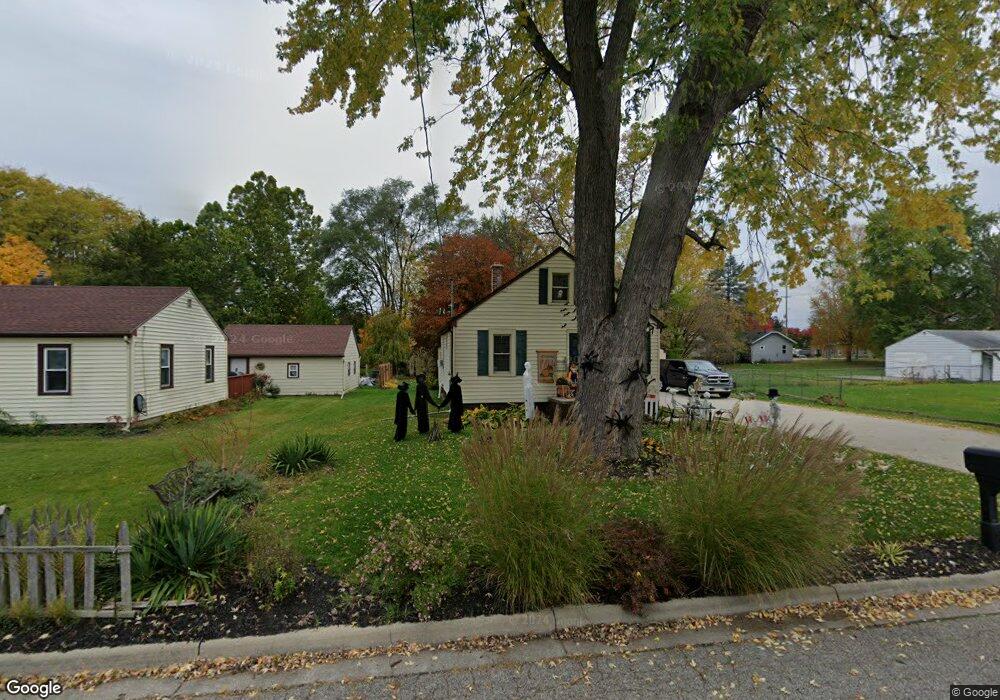
This home is located at 6116 Daft St, Lansing, MI 48911 and is currently estimated at $139,879, approximately $130 per square foot. 6116 Daft St is a home located in Ingham County with nearby schools including Reo Elementary School, Attwood School, and Everett High School.
Ownership History
Date
Name
Owned For
Owner Type
Purchase Details
Closed on
Feb 19, 2025
Sold by
Rinckey Joyce T
Bought by
Joyce T Rinckey Living Trust and Rinckey
Current Estimated Value
Purchase Details
Closed on
Feb 7, 2003
Sold by
Rinckey Brad A
Bought by
Rinckey Brad A and Rinckey Joyce T
Home Financials for this Owner
Home Financials are based on the most recent Mortgage that was taken out on this home.
Original Mortgage
$28,600
Interest Rate
6%
Purchase Details
Closed on
Feb 7, 2000
Sold by
Markey Family Investments Llc
Bought by
Rinckey Brad and Rinckey Joyce
Create a Home Valuation Report for This Property
The Home Valuation Report is an in-depth analysis detailing your home's value as well as a comparison with similar homes in the area
Home Values in the Area
Average Home Value in this Area
Purchase History
| Date | Buyer | Sale Price | Title Company |
|---|---|---|---|
| Joyce T Rinckey Living Trust | -- | None Listed On Document | |
| Rinckey Brad A | -- | -- | |
| Rinckey Brad | $1,500 | -- |
Source: Public Records
Mortgage History
| Date | Status | Borrower | Loan Amount |
|---|---|---|---|
| Previous Owner | Rinckey Brad A | $28,600 |
Source: Public Records
Tax History
| Year | Tax Paid | Tax Assessment Tax Assessment Total Assessment is a certain percentage of the fair market value that is determined by local assessors to be the total taxable value of land and additions on the property. | Land | Improvement |
|---|---|---|---|---|
| 2025 | $2,244 | $68,300 | $8,500 | $59,800 |
| 2024 | $18 | $51,700 | $8,500 | $43,200 |
| 2023 | $2,106 | $45,200 | $8,500 | $36,700 |
| 2022 | $1,901 | $42,700 | $8,700 | $34,000 |
| 2021 | $1,861 | $39,400 | $7,700 | $31,700 |
| 2020 | $1,850 | $37,400 | $7,700 | $29,700 |
| 2019 | $1,772 | $32,800 | $7,700 | $25,100 |
| 2018 | $1,662 | $28,700 | $7,700 | $21,000 |
| 2017 | $1,591 | $28,700 | $7,700 | $21,000 |
| 2016 | $1,521 | $28,200 | $7,700 | $20,500 |
| 2015 | $1,521 | $27,400 | $15,352 | $12,048 |
| 2014 | $1,521 | $26,500 | $18,292 | $8,208 |
Source: Public Records
Map
Nearby Homes
- 1020 R G Curtiss Ave
- 826 R G Curtiss Ave
- 6037 Hughes Rd
- 5902 Haag Rd
- 6421 S Washington Ave
- 5641 Ashley Dr
- 1406 Weymouth Ct
- 1309 Penrod Ct
- 5838 S Martin Luther King Junior Blvd
- 6444 Sommerset Rd
- 5650 Hughes Rd
- 6817 S Washington Ave
- 6429 Rosedale Rd
- 115 E Claremore Dr
- 5815 Caleta Dr
- 5267 Crocus Ave
- 6246 Gardenia Ave
- 125 E Northrup St
- 6935 Vernson Dr
- 0 W Jolly Rd
- 6122 Daft St
- 1011 W Ller
- 1011 W Miller Rd
- 1018 Southfield Ave
- 1103 W Miller Rd
- 957 W Miller Rd
- 6117 Daft St
- 6121 Daft St
- 1022 Southfield Ave
- 6123 Daft St
- 6200 Daft St
- 1107 W Miller Rd
- 1009 Southfield Ave
- 1113 W Miller Rd
- 1023 Southfield Ave
- 1008 W Miller Rd
- W Miller Rd
- 1000 W Miller Rd
- 945 W Miller Rd
Your Personal Tour Guide
Ask me questions while you tour the home.