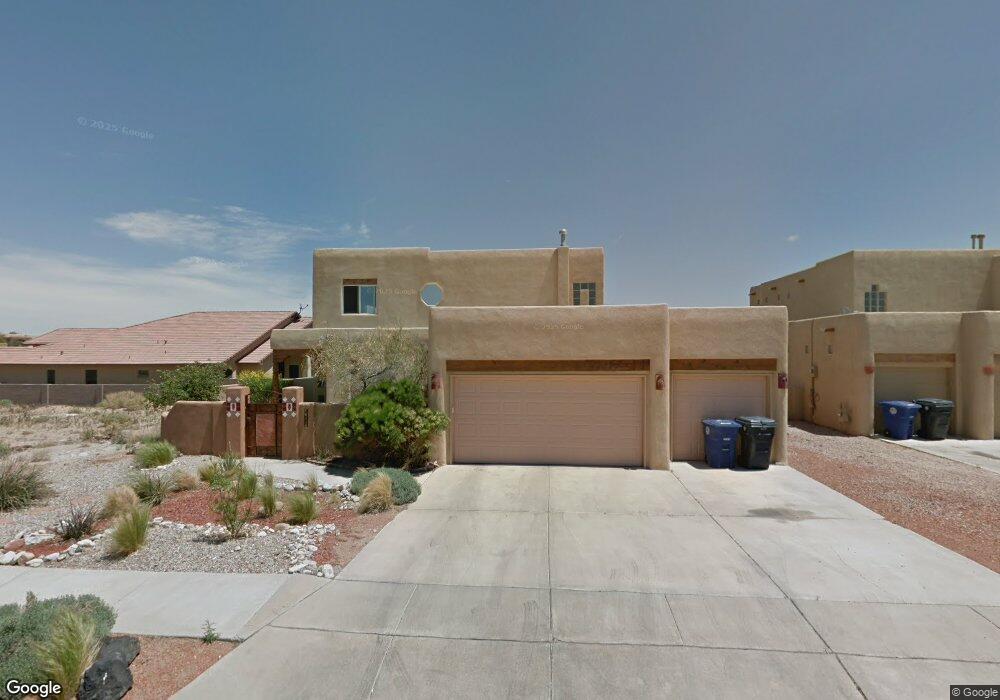
6116 Little Joe Place NW Albuquerque, NM 87120
Taylor Ranch NeighborhoodEstimated Value: $458,000 - $567,000
4
Beds
3
Baths
2,954
Sq Ft
$168/Sq Ft
Est. Value
About This Home
This home is located at 6116 Little Joe Place NW, Albuquerque, NM 87120 and is currently estimated at $495,079, approximately $167 per square foot. 6116 Little Joe Place NW is a home located in Bernalillo County with nearby schools including Marie M. Hughes Elementary School, L.B. Johnson Middle School, and Volcano Vista High School.
Ownership History
Date
Name
Owned For
Owner Type
Purchase Details
Closed on
Jan 27, 2014
Sold by
Latham Carol A and Vanpelf Stacey K
Bought by
Vanpelt Stacey
Current Estimated Value
Home Financials for this Owner
Home Financials are based on the most recent Mortgage that was taken out on this home.
Original Mortgage
$152,000
Outstanding Balance
$79,368
Interest Rate
4.49%
Mortgage Type
New Conventional
Estimated Equity
$415,711
Purchase Details
Closed on
Feb 13, 2003
Sold by
Latham Carol A
Bought by
Latham Carol A and Vanpelt Stacey K
Home Financials for this Owner
Home Financials are based on the most recent Mortgage that was taken out on this home.
Original Mortgage
$207,000
Interest Rate
5.9%
Purchase Details
Closed on
Mar 7, 2000
Sold by
Mnc Inc
Bought by
Latham Carol A
Home Financials for this Owner
Home Financials are based on the most recent Mortgage that was taken out on this home.
Original Mortgage
$204,383
Interest Rate
8.29%
Create a Home Valuation Report for This Property
The Home Valuation Report is an in-depth analysis detailing your home's value as well as a comparison with similar homes in the area
Home Values in the Area
Average Home Value in this Area
Purchase History
| Date | Buyer | Sale Price | Title Company |
|---|---|---|---|
| Vanpelt Stacey | -- | Stewart Title | |
| Latham Carol A | -- | Fidelity National Title Co | |
| Latham Carol A | -- | Fidelity National Title Ins |
Source: Public Records
Mortgage History
| Date | Status | Borrower | Loan Amount |
|---|---|---|---|
| Open | Vanpelt Stacey | $152,000 | |
| Previous Owner | Latham Carol A | $207,000 | |
| Previous Owner | Latham Carol A | $204,383 |
Source: Public Records
Tax History Compared to Growth
Tax History
| Year | Tax Paid | Tax Assessment Tax Assessment Total Assessment is a certain percentage of the fair market value that is determined by local assessors to be the total taxable value of land and additions on the property. | Land | Improvement |
|---|---|---|---|---|
| 2025 | $4,101 | $100,112 | $19,203 | $80,909 |
| 2024 | $4,101 | $97,195 | $18,643 | $78,552 |
| 2023 | $4,033 | $94,365 | $18,101 | $76,264 |
| 2022 | $3,897 | $91,617 | $17,574 | $74,043 |
| 2021 | $3,766 | $88,949 | $17,062 | $71,887 |
| 2020 | $3,704 | $86,358 | $16,565 | $69,793 |
| 2019 | $3,722 | $86,804 | $18,643 | $68,161 |
| 2018 | $3,590 | $86,804 | $18,643 | $68,161 |
| 2017 | $3,480 | $84,277 | $18,101 | $66,176 |
| 2016 | $3,380 | $79,439 | $17,062 | $62,377 |
| 2015 | $77,126 | $77,126 | $16,565 | $60,561 |
| 2014 | $3,275 | $77,126 | $16,565 | $60,561 |
| 2013 | -- | $77,759 | $16,565 | $61,194 |
Source: Public Records
Map
Nearby Homes
- 6020 Jamers Place NW
- 6101 Chimayo Dr NW
- 5901 Chimayo Dr NW
- 0 Santo Domingo St NW Unit 1072927
- 5805 Chimayo Dr NW
- 6427 Pojoaque Dr NW
- 6420 Pojoaque Rd NW
- 6133 Flor de Mayo Place NW
- 6304 Flor Del Sol Place NW
- 0 Unser Blvd NW
- 6005 Rio Pueblo Dr NW
- 6116 Agate Ave NW
- 6705 Lamar Ave NW
- 5504 Hayes Dr NW
- 6720 Lamar Ave NW
- 6616 Meadow Lake Place NW
- 6615 Astair Ave NW Unit 1
- 7904 Marigold Dr NW
- 6200 Marigold Ct NW
- 6618 Azuelo Ave NW
- 6112 Little Joe Place NW
- 6308 Crystal St NW
- 6304 Crystal Ave NW
- 6115 Whiteman Dr NW
- 6108 Little Joe Place NW
- 6109 Whiteman Dr NW
- 6119 Whiteman Dr NW
- 6115 Little Joe Place NW
- 6119 Little Joe Place NW
- 9209 Crystal St NW
- 9204 Crystal St NW
- 9200 Crystal St NW
- 6123 Little Joe Place NW
- 6107 Whiteman Dr NW
- 6127 Little Joe Place NW
- 6109 Little Joe Place NW
- 6104 Little Joe Place NW
- 6200 Little Joe Place NW
- 6105 Whiteman Dr NW
- 6201 Whiteman Dr NW