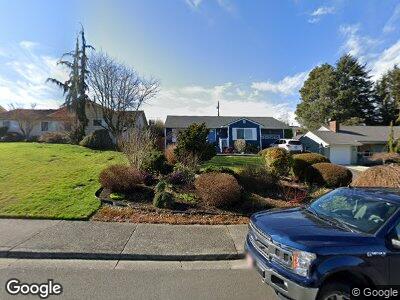
612 Colby Ave Everett, WA 98201
Northwest Everett NeighborhoodEstimated Value: $658,030 - $846,000
3
Beds
2
Baths
1,143
Sq Ft
$659/Sq Ft
Est. Value
About This Home
This home is located at 612 Colby Ave, Everett, WA 98201 and is currently estimated at $753,258, approximately $659 per square foot. 612 Colby Ave is a home located in Snohomish County with nearby schools including Whittier Elementary School, North Middle School, and Everett High School.
Ownership History
Date
Name
Owned For
Owner Type
Purchase Details
Closed on
Nov 1, 2010
Sold by
Olsen Wade
Bought by
Olsen Judy
Current Estimated Value
Home Financials for this Owner
Home Financials are based on the most recent Mortgage that was taken out on this home.
Original Mortgage
$175,000
Outstanding Balance
$119,367
Interest Rate
4.33%
Mortgage Type
New Conventional
Estimated Equity
$511,030
Purchase Details
Closed on
Dec 26, 2003
Sold by
Bowen Wayne D
Bought by
Bowen Kathleen A
Home Financials for this Owner
Home Financials are based on the most recent Mortgage that was taken out on this home.
Original Mortgage
$189,000
Interest Rate
6.03%
Mortgage Type
Purchase Money Mortgage
Purchase Details
Closed on
May 13, 2003
Sold by
The Tamul Revocable Trust
Bought by
Burke Cory and Burke Geneanne
Purchase Details
Closed on
Sep 29, 1997
Sold by
Tamul John M
Bought by
Tamul John M and Tamul Revocable Trust
Create a Home Valuation Report for This Property
The Home Valuation Report is an in-depth analysis detailing your home's value as well as a comparison with similar homes in the area
Home Values in the Area
Average Home Value in this Area
Purchase History
| Date | Buyer | Sale Price | Title Company |
|---|---|---|---|
| Olsen Judy | -- | Chicago | |
| Olsen Judy | $300,000 | Chicago Title | |
| Bowen Kathleen A | -- | Stewart Title Company | |
| Bowen Kathleen A | $210,000 | Stewart Title Company | |
| Burke Cory | -- | First American Title Ins Co | |
| Tamul John M | -- | -- |
Source: Public Records
Mortgage History
| Date | Status | Borrower | Loan Amount |
|---|---|---|---|
| Open | Olsen Judy | $175,000 | |
| Previous Owner | Kenney Kathleen A | $280,000 | |
| Previous Owner | Bowen Kathleen A | $35,000 | |
| Previous Owner | Bowen Kathleen A | $189,000 |
Source: Public Records
Tax History Compared to Growth
Tax History
| Year | Tax Paid | Tax Assessment Tax Assessment Total Assessment is a certain percentage of the fair market value that is determined by local assessors to be the total taxable value of land and additions on the property. | Land | Improvement |
|---|---|---|---|---|
| 2025 | $716 | $593,000 | $387,000 | $206,000 |
| 2024 | $716 | $600,500 | $394,500 | $206,000 |
| 2023 | $704 | $658,200 | $451,100 | $207,100 |
| 2022 | $839 | $450,200 | $274,600 | $175,600 |
| 2020 | $4,260 | $379,500 | $229,000 | $150,500 |
| 2019 | $3,992 | $357,900 | $210,000 | $147,900 |
| 2018 | $3,848 | $316,200 | $184,300 | $131,900 |
| 2017 | $3,645 | $298,300 | $174,800 | $123,500 |
| 2016 | $3,201 | $275,400 | $156,800 | $118,600 |
| 2015 | $3,154 | $255,600 | $155,800 | $99,800 |
| 2013 | $2,560 | $183,100 | $96,100 | $87,000 |
Source: Public Records
Map
Nearby Homes
- 815 Hoyt Ave
- 421 Rockefeller Ave
- 1015 Colby Ave
- 1109 Hoyt Ave
- 626 Legion Dr
- 3007 Belmonte Ln
- 3011 Belmonte Ln
- 532 Pilchuck Path
- 3021 Belmonte Ln
- 2312 Jade Ave
- 1501 Broadway
- 1611 Oakes Ave
- 1713 17th St
- 901 E Marine View Dr Unit 201
- 815 E Marine View Dr
- 1531 Virginia Ave Unit 1
- 1601 Virginia Ave
- 1911 Rucker Ave
- 1917 Grand Ave
- 1928 Virginia Ave