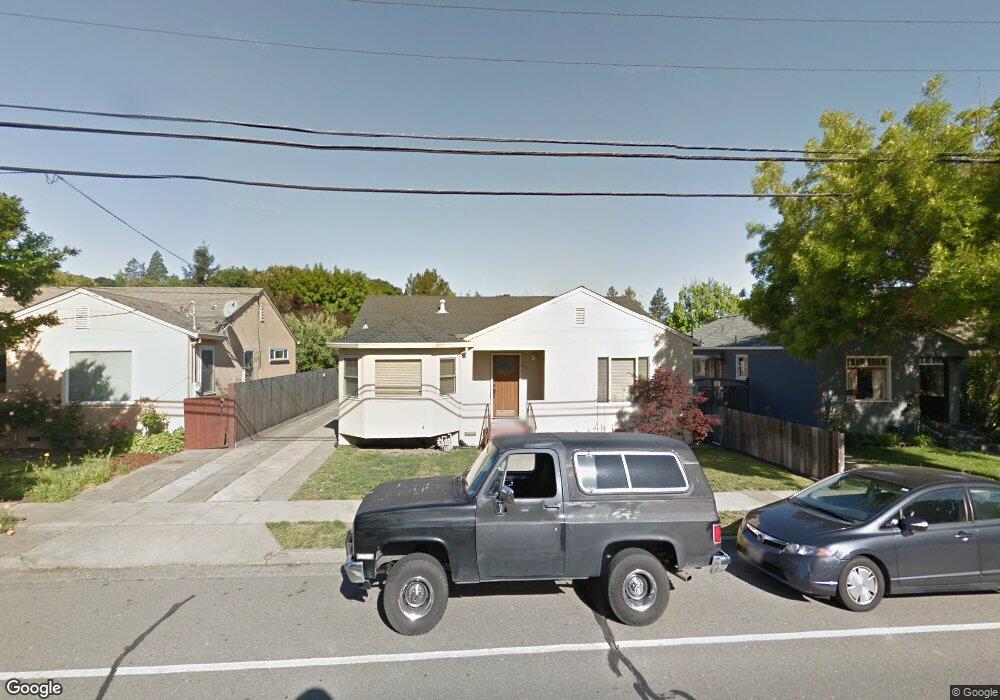
612 Mountain View Ave Petaluma, CA 94952
Western Petaluma NeighborhoodEstimated Value: $685,000 - $840,000
--
Bed
--
Bath
64
Sq Ft
$12,021/Sq Ft
Est. Value
About This Home
This home is located at 612 Mountain View Ave, Petaluma, CA 94952 and is currently estimated at $769,333, approximately $12,020 per square foot. 612 Mountain View Ave is a home located in Sonoma County with nearby schools including McNear Elementary School, Petaluma Junior High School, and Petaluma High School.
Ownership History
Date
Name
Owned For
Owner Type
Purchase Details
Closed on
Nov 2, 2017
Sold by
Pedersen Christine E
Bought by
Pedersen Christine E
Current Estimated Value
Home Financials for this Owner
Home Financials are based on the most recent Mortgage that was taken out on this home.
Original Mortgage
$200,000
Interest Rate
3.85%
Mortgage Type
New Conventional
Purchase Details
Closed on
Sep 4, 2014
Sold by
Pedersen Christine E and Gary C Pedersen 2013 Trust
Bought by
Pedersen Christine E
Purchase Details
Closed on
Mar 4, 2013
Sold by
Pedersen Gary C and The Gary C Pedersen 2012 Trust
Bought by
Pedersen Gary C and The Gary C Pedersen 2013 Trust
Purchase Details
Closed on
Jan 14, 2013
Sold by
Pedersen Gary C
Bought by
Pedersen Gary C and The Gary C Pedersen 2012 Trust
Purchase Details
Closed on
Mar 11, 1997
Sold by
Pedersen Gary C and Pedersen Diane L
Bought by
Pedersen Gary C
Create a Home Valuation Report for This Property
The Home Valuation Report is an in-depth analysis detailing your home's value as well as a comparison with similar homes in the area
Home Values in the Area
Average Home Value in this Area
Purchase History
| Date | Buyer | Sale Price | Title Company |
|---|---|---|---|
| Pedersen Christine E | -- | Entitle Insurance Company | |
| Pedersen Christine E | -- | None Available | |
| Pedersen Gary C | -- | None Available | |
| Pedersen Gary C | -- | None Available | |
| Pedersen Gary C | -- | -- |
Source: Public Records
Mortgage History
| Date | Status | Borrower | Loan Amount |
|---|---|---|---|
| Closed | Pedersen Christine E | $200,000 |
Source: Public Records
Tax History Compared to Growth
Tax History
| Year | Tax Paid | Tax Assessment Tax Assessment Total Assessment is a certain percentage of the fair market value that is determined by local assessors to be the total taxable value of land and additions on the property. | Land | Improvement |
|---|---|---|---|---|
| 2025 | $875 | $60,645 | $32,489 | $28,156 |
| 2024 | $875 | $59,456 | $31,852 | $27,604 |
| 2023 | $875 | $58,291 | $31,228 | $27,063 |
| 2022 | $773 | $57,149 | $30,616 | $26,533 |
| 2021 | $761 | $56,029 | $30,016 | $26,013 |
| 2020 | $766 | $55,456 | $29,709 | $25,747 |
| 2019 | $758 | $54,370 | $29,127 | $25,243 |
| 2018 | $756 | $53,305 | $28,556 | $24,749 |
| 2017 | $743 | $52,261 | $27,997 | $24,264 |
| 2016 | $718 | $51,238 | $27,449 | $23,789 |
| 2015 | -- | $50,469 | $27,037 | $23,432 |
| 2014 | -- | $49,481 | $26,508 | $22,973 |
Source: Public Records
Map
Nearby Homes
- 4 George Terrace
- 5 George Terrace
- 886 Olive St
- 21 Branching Way
- 9 Arlene Ct
- 1028 Addison Cir
- 720 Petaluma Blvd S Unit 27
- 720 Petaluma Blvd S Unit 30
- 720 Petaluma Blvd S Unit 39
- 143 Mcnear Cir
- 244 Mcnear Cir
- 221 Preston Ct
- 1170 I St
- 218 Jacquelyn Ln
- 45 Augusta Cir
- 15 Kingswood Dr
- 303 Jacquelyn Ln
- 5 Troon Terrace
- 0 Lakeville St
- 853 D St