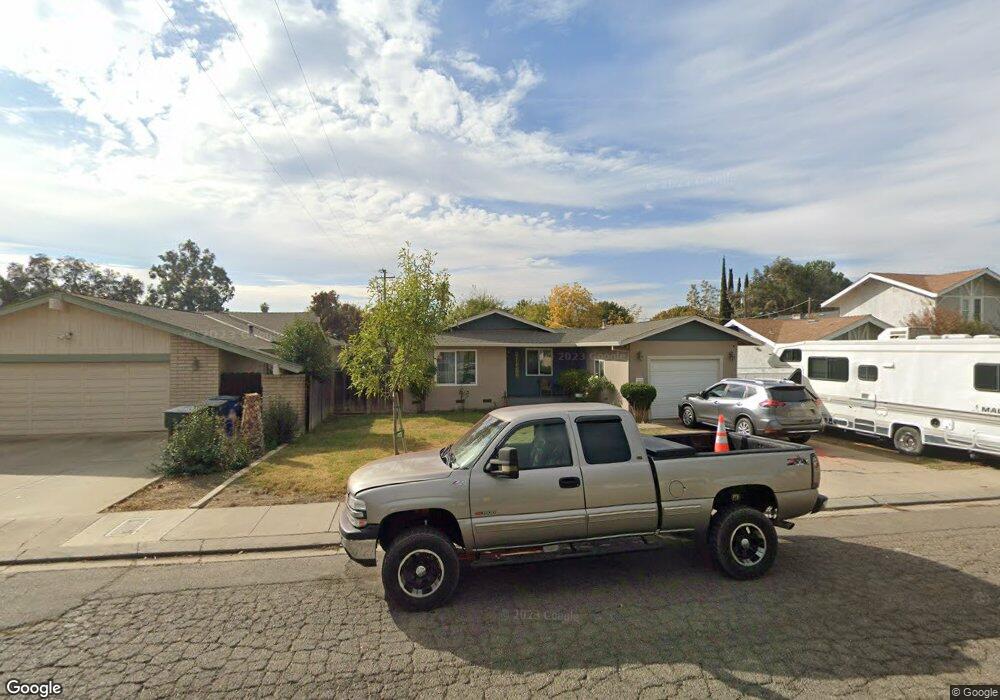
612 N 3rd St Patterson, CA 95363
Estimated Value: $374,000 - $414,912
3
Beds
2
Baths
1,344
Sq Ft
$293/Sq Ft
Est. Value
About This Home
This home is located at 612 N 3rd St, Patterson, CA 95363 and is currently estimated at $394,228, approximately $293 per square foot. 612 N 3rd St is a home located in Stanislaus County with nearby schools including Northmead Elementary School, Creekside Middle School, and Patterson High School.
Ownership History
Date
Name
Owned For
Owner Type
Purchase Details
Closed on
Sep 22, 2007
Sold by
Bearrup Donovan K and Flores Bearrup Ermelinda
Bought by
Bearrup Donovan K and Flores Bearrup Ermelinda
Current Estimated Value
Purchase Details
Closed on
Jan 19, 2005
Sold by
Garcia Frank and Garcia Luisa
Bought by
Bearrup Donovan and Flores Bearrup Ermelinda
Home Financials for this Owner
Home Financials are based on the most recent Mortgage that was taken out on this home.
Original Mortgage
$168,500
Interest Rate
5.67%
Mortgage Type
New Conventional
Create a Home Valuation Report for This Property
The Home Valuation Report is an in-depth analysis detailing your home's value as well as a comparison with similar homes in the area
Home Values in the Area
Average Home Value in this Area
Purchase History
We collect this data history from publicly available records. To have your information removed, we recommend requesting removal directly through your county’s website.
| Date | Buyer | Sale Price | Title Company |
|---|---|---|---|
| Bearrup Donovan K | -- | None Available | |
| Bearrup Donovan K | -- | None Available | |
| Bearrup Donovan | $148,000 | Fidelity National Title |
Source: Public Records
Mortgage History
We collect this data history from publicly available records. To have your information removed, we recommend requesting removal directly through your county’s website.
| Date | Status | Borrower | Loan Amount |
|---|---|---|---|
| Closed | Bearrup Donovan | $168,500 |
Source: Public Records
Tax History
| Year | Tax Paid | Tax Assessment Tax Assessment Total Assessment is a certain percentage of the fair market value that is determined by local assessors to be the total taxable value of land and additions on the property. | Land | Improvement |
|---|---|---|---|---|
| 2025 | $3,269 | $281,917 | $145,017 | $136,900 |
| 2024 | $3,260 | $276,390 | $142,174 | $134,216 |
| 2023 | $3,186 | $270,972 | $139,387 | $131,585 |
| 2022 | $3,003 | $265,659 | $136,654 | $129,005 |
| 2021 | $2,979 | $260,451 | $133,975 | $126,476 |
| 2020 | $2,962 | $257,782 | $132,602 | $125,180 |
| 2019 | $2,917 | $252,728 | $130,002 | $122,726 |
| 2018 | $2,774 | $247,773 | $127,453 | $120,320 |
| 2017 | $2,518 | $225,000 | $105,000 | $120,000 |
| 2016 | $2,153 | $193,500 | $60,000 | $133,500 |
| 2015 | $1,907 | $171,000 | $24,000 | $147,000 |
| 2014 | $1,588 | $142,500 | $20,000 | $122,500 |
Source: Public Records
Map
Nearby Homes
- 315 M St
- 140 Ivy Ave Unit A5
- 140 Ivy Ave Unit 39
- 941 Arambel Dr
- 154 Brook Hollow Dr
- 201 N 7th St
- 608 Somerset Way
- 1430 Walnut Ave
- 673 Dorset Dr
- 801 Chatham Ln
- 809 Chatham Ln
- 817 Chatham Ln
- 821 Chatham Ln
- 829 Chatham Ln
- 800 Chatham Ln
- 816 Chatham Ln
- 820 Chatham Ln
- 817 Helmsley Ln
- 821 Helmsley Ln
- 816 Helmsley Ln
Your Personal Tour Guide
Ask me questions while you tour the home.