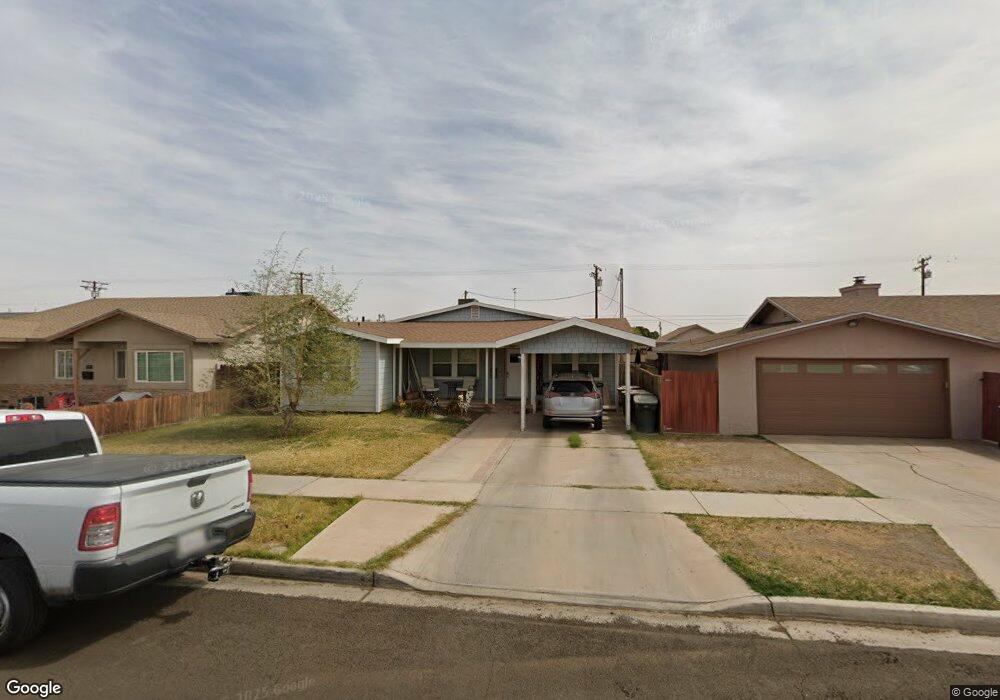
612 S G St Imperial, CA 92251
Estimated Value: $275,119 - $352,000
3
Beds
1
Bath
1,109
Sq Ft
$277/Sq Ft
Est. Value
About This Home
This home is located at 612 S G St, Imperial, CA 92251 and is currently estimated at $307,280, approximately $277 per square foot. 612 S G St is a home located in Imperial County with nearby schools including Ben Hulse Elementary School, Frank M. Wright Middle School, and Imperial High School.
Ownership History
Date
Name
Owned For
Owner Type
Purchase Details
Closed on
Apr 16, 2008
Sold by
Weldon Stephanie L and Weldon David
Bought by
Weldon David and Weldon Stephanie L
Current Estimated Value
Home Financials for this Owner
Home Financials are based on the most recent Mortgage that was taken out on this home.
Original Mortgage
$159,000
Interest Rate
5.88%
Mortgage Type
New Conventional
Purchase Details
Closed on
Jan 10, 2002
Sold by
Shaner Stephanie L
Bought by
Weldon David and Weldon Stephanie L
Purchase Details
Closed on
Jan 29, 1998
Sold by
1995 Trust Watkins William Norman & Stella Pa and Watkins Stella Pauline
Bought by
Shaner Stephanie L
Home Financials for this Owner
Home Financials are based on the most recent Mortgage that was taken out on this home.
Original Mortgage
$78,847
Interest Rate
6.97%
Mortgage Type
FHA
Create a Home Valuation Report for This Property
The Home Valuation Report is an in-depth analysis detailing your home's value as well as a comparison with similar homes in the area
Home Values in the Area
Average Home Value in this Area
Purchase History
| Date | Buyer | Sale Price | Title Company |
|---|---|---|---|
| Weldon David | -- | Chicago Title Company | |
| Weldon David | -- | -- | |
| Shaner Stephanie L | $79,000 | Commonwealth Land Title Ins |
Source: Public Records
Mortgage History
| Date | Status | Borrower | Loan Amount |
|---|---|---|---|
| Closed | Weldon David | $159,000 | |
| Previous Owner | Shaner Stephanie L | $78,847 |
Source: Public Records
Tax History Compared to Growth
Tax History
| Year | Tax Paid | Tax Assessment Tax Assessment Total Assessment is a certain percentage of the fair market value that is determined by local assessors to be the total taxable value of land and additions on the property. | Land | Improvement |
|---|---|---|---|---|
| 2025 | $1,302 | $126,116 | $47,887 | $78,229 |
| 2023 | $1,302 | $121,222 | $46,029 | $75,193 |
| 2022 | $1,271 | $118,846 | $45,127 | $73,719 |
| 2021 | $1,250 | $116,517 | $44,243 | $72,274 |
| 2020 | $1,237 | $115,323 | $43,790 | $71,533 |
| 2019 | $1,218 | $113,063 | $42,932 | $70,131 |
| 2018 | $1,201 | $110,847 | $42,091 | $68,756 |
| 2017 | $1,130 | $108,674 | $41,266 | $67,408 |
| 2016 | $1,087 | $106,544 | $40,457 | $66,087 |
| 2015 | $1,098 | $104,945 | $39,850 | $65,095 |
| 2014 | $874 | $88,720 | $40,000 | $48,720 |
Source: Public Records
Map
Nearby Homes