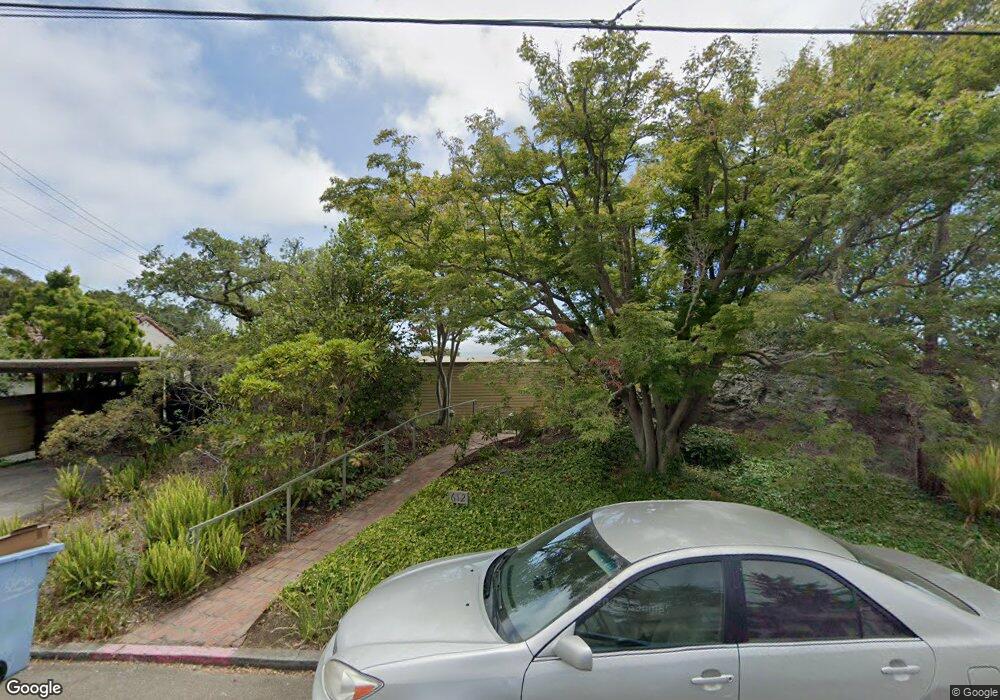
612 San Luis Rd Berkeley, CA 94707
Estimated Value: $1,391,000 - $1,619,000
2
Beds
2
Baths
1,402
Sq Ft
$1,084/Sq Ft
Est. Value
About This Home
This home is located at 612 San Luis Rd, Berkeley, CA 94707 and is currently estimated at $1,519,210, approximately $1,083 per square foot. 612 San Luis Rd is a home located in Alameda County with nearby schools including Thousand Oaks Elementary School, Berkeley Arts Magnet at Whittier School, and Ruth Acty Elementary.
Ownership History
Date
Name
Owned For
Owner Type
Purchase Details
Closed on
Mar 5, 2019
Sold by
Dehlinger Daniel and Dehlinger Richard
Bought by
Johnson James
Current Estimated Value
Home Financials for this Owner
Home Financials are based on the most recent Mortgage that was taken out on this home.
Original Mortgage
$900,000
Outstanding Balance
$581,105
Interest Rate
4.4%
Mortgage Type
New Conventional
Estimated Equity
$938,105
Purchase Details
Closed on
Aug 2, 2007
Sold by
Dehlinger Dehlinger Klaus Klaus and Dehlinger Klaus
Bought by
Dehlinger Dehlinger Klaus Klaus and Dehlinger Klaus
Purchase Details
Closed on
Oct 25, 2006
Sold by
Grundy Richard David and Grundy Jeffrey A
Bought by
Dehlinger Klaus and The Klaus Dehlinger & Jean Deh
Purchase Details
Closed on
Dec 11, 1997
Sold by
Ginner Margaret E
Bought by
Ginner Margaret E and The Margaret E Ginner Revocabl
Create a Home Valuation Report for This Property
The Home Valuation Report is an in-depth analysis detailing your home's value as well as a comparison with similar homes in the area
Home Values in the Area
Average Home Value in this Area
Purchase History
| Date | Buyer | Sale Price | Title Company |
|---|---|---|---|
| Johnson James | $1,125,000 | Chicago Title Company | |
| Dehlinger Dehlinger Klaus Klaus | -- | First American Title Co | |
| Dehlinger Klaus | $950,000 | Placer Title Company | |
| Ginner Margaret E | -- | -- |
Source: Public Records
Mortgage History
| Date | Status | Borrower | Loan Amount |
|---|---|---|---|
| Open | Johnson James | $900,000 |
Source: Public Records
Tax History
| Year | Tax Paid | Tax Assessment Tax Assessment Total Assessment is a certain percentage of the fair market value that is determined by local assessors to be the total taxable value of land and additions on the property. | Land | Improvement |
|---|---|---|---|---|
| 2025 | $18,472 | $1,254,937 | $613,525 | $641,412 |
| 2024 | $18,472 | $1,230,333 | $601,496 | $628,837 |
| 2023 | $18,097 | $1,206,213 | $589,704 | $616,509 |
| 2022 | $17,791 | $1,182,565 | $578,143 | $604,422 |
| 2021 | $17,847 | $1,159,380 | $566,808 | $592,572 |
| 2020 | $16,934 | $1,147,500 | $561,000 | $586,500 |
| 2019 | $4,070 | $126,665 | $52,745 | $73,920 |
| 2018 | $3,953 | $124,182 | $51,711 | $72,471 |
| 2017 | $3,783 | $121,749 | $50,698 | $71,051 |
| 2016 | $3,523 | $119,362 | $49,704 | $69,658 |
| 2015 | $3,453 | $117,570 | $48,958 | $68,612 |
| 2014 | $3,326 | $115,268 | $47,999 | $67,269 |
Source: Public Records
Map
Nearby Homes
- 589 San Luis Rd
- 483 Boynton Ave
- 450 Vermont Ave
- 765 San Diego Rd
- 380 Vermont Ave
- 470 Spruce St
- 1983 Yosemite Rd
- 614 Cragmont Ave
- 758 Spruce St
- 813 San Diego Rd
- 410 Grizzly Peak Blvd
- 777 Cragmont Ave
- 606 Grizzly Peak Blvd
- 1858 San Lorenzo Ave
- 491 Vincente Ave
- 543 Grizzly Peak Blvd
- 255 Stanford Ave
- 290 Colgate Ave
- 249 Trinity Ave
- 201 Amherst Ave
- 618 San Luis Rd
- 608 San Luis Rd
- 1945 San Antonio Ave
- 1959 San Antonio Ave
- 622 San Luis Rd
- 1939 San Antonio Ave
- 1965 San Antonio Ave
- 615 San Luis Rd
- 611 San Luis Rd
- 607 San Luis Rd
- 621 San Luis Rd
- 626 San Luis Rd
- 601 San Luis Rd
- 594 San Luis Rd
- 623 San Luis Rd
- 1933 San Antonio Ave
- 597 San Luis Rd
- 1950 San Antonio Ave
- 632 San Luis Rd
- 1934 San Antonio Ave
Your Personal Tour Guide
Ask me questions while you tour the home.