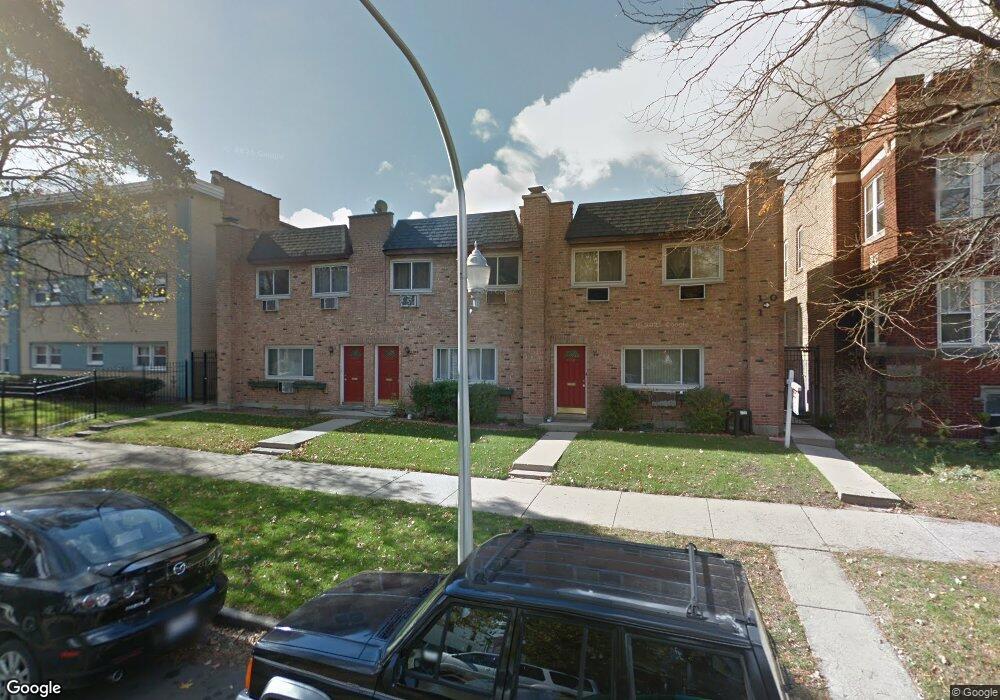
6120 N Hermitage Ave Unit 6120 Chicago, IL 60660
Edgewater NeighborhoodEstimated Value: $164,000 - $214,967
--
Bed
--
Bath
--
Sq Ft
10,542
Sq Ft Lot
About This Home
This home is located at 6120 N Hermitage Ave Unit 6120, Chicago, IL 60660 and is currently estimated at $196,742. 6120 N Hermitage Ave Unit 6120 is a home located in Cook County with nearby schools including Hayt Elementary School, Senn High School, and Passages Elementary Charter School.
Ownership History
Date
Name
Owned For
Owner Type
Purchase Details
Closed on
Jul 27, 2021
Sold by
Olen John
Bought by
Butkus Brendan L
Current Estimated Value
Home Financials for this Owner
Home Financials are based on the most recent Mortgage that was taken out on this home.
Original Mortgage
$130,950
Outstanding Balance
$119,128
Interest Rate
2.93%
Mortgage Type
New Conventional
Estimated Equity
$77,614
Purchase Details
Closed on
Nov 18, 2011
Sold by
U S Bank National Association
Bought by
Olen John
Purchase Details
Closed on
Oct 4, 2010
Sold by
Nelson Amy
Bought by
U S Bank National Association
Purchase Details
Closed on
Dec 19, 2005
Sold by
6118 & 22 N Hermitage Llc
Bought by
Nelson Amy
Home Financials for this Owner
Home Financials are based on the most recent Mortgage that was taken out on this home.
Original Mortgage
$22,400
Interest Rate
6.4%
Mortgage Type
Stand Alone Second
Create a Home Valuation Report for This Property
The Home Valuation Report is an in-depth analysis detailing your home's value as well as a comparison with similar homes in the area
Home Values in the Area
Average Home Value in this Area
Purchase History
| Date | Buyer | Sale Price | Title Company |
|---|---|---|---|
| Butkus Brendan L | $135,000 | Truly Title | |
| Olen John | $31,000 | None Available | |
| U S Bank National Association | -- | None Available | |
| Nelson Amy | $112,000 | None Available |
Source: Public Records
Mortgage History
| Date | Status | Borrower | Loan Amount |
|---|---|---|---|
| Open | Butkus Brendan L | $130,950 | |
| Previous Owner | Nelson Amy | $22,400 | |
| Previous Owner | Nelson Amy | $89,600 |
Source: Public Records
Tax History Compared to Growth
Tax History
| Year | Tax Paid | Tax Assessment Tax Assessment Total Assessment is a certain percentage of the fair market value that is determined by local assessors to be the total taxable value of land and additions on the property. | Land | Improvement |
|---|---|---|---|---|
| 2024 | $3,376 | $12,210 | $3,729 | $8,481 |
| 2023 | $3,291 | $16,000 | $3,007 | $12,993 |
| 2022 | $3,291 | $16,000 | $3,007 | $12,993 |
| 2021 | $2,548 | $15,999 | $3,007 | $12,992 |
| 2020 | $1,629 | $10,417 | $2,405 | $8,012 |
| 2019 | $1,649 | $11,635 | $2,405 | $9,230 |
| 2018 | $1,620 | $11,635 | $2,405 | $9,230 |
| 2017 | $1,677 | $11,166 | $2,045 | $9,121 |
| 2016 | $1,736 | $11,166 | $2,045 | $9,121 |
| 2015 | $1,565 | $11,166 | $2,045 | $9,121 |
| 2014 | $1,117 | $8,588 | $1,533 | $7,055 |
| 2013 | $1,084 | $8,588 | $1,533 | $7,055 |
Source: Public Records
Map
Nearby Homes
- 6129 N Ravenswood Ave
- 6065 N Hermitage Ave
- 1823 W Granville Ave Unit 4A
- 6220 N Ridge Ave Unit S203
- 6220 N Ridge Ave Unit S307
- 6025 N Ridge Ave Unit 1W
- 6149 N Wolcott Ave Unit 4D
- 6019 N Paulina St
- 6321 N Hermitage Ave
- 1910 W Hood Ave Unit GA
- 1921 W Hood Ave Unit 3B
- 1937 W Granville Ave Unit 1
- 1939 W Granville Ave Unit 1
- 1626 W Highland Ave Unit 1W
- 6028 N Winchester Ave
- 1954 W Hood Ave Unit 1B
- 1958 W Norwood St Unit 4B
- 1960 W Hood Ave Unit 3B
- 6021 N Damen Ave Unit 202
- 1542 W Highland Ave
- 6122 N Hermitage Ave Unit B
- 6120 N Hermitage Ave Unit 6120
- 6120 N Hermitage Ave Unit 6120
- 6122 N Hermitage Ave Unit 6122
- 6120 N Hermitage Ave Unit 6120
- 6120 N Hermitage Ave Unit 6120
- 6122 N Hermitage Ave Unit 6122
- 6120 N Hermitage Ave Unit 6120
- 6120 N Hermitage Ave Unit 6120
- 6122 N Hermitage Ave Unit P8
- 6122 N Hermitage Ave Unit P7
- 6122 N Hermitage Ave Unit P6
- 6122 N Hermitage Ave Unit P5
- 6122 N Hermitage Ave Unit P4
- 6122 N Hermitage Ave Unit P3
- 6122 N Hermitage Ave Unit P1
- 6122 N Hermitage Ave Unit 6122
- 6120 N Hermitage Ave Unit 6120
- 6122 N Hermitage Ave Unit P2
- 6122 N Hermitage Ave Unit A