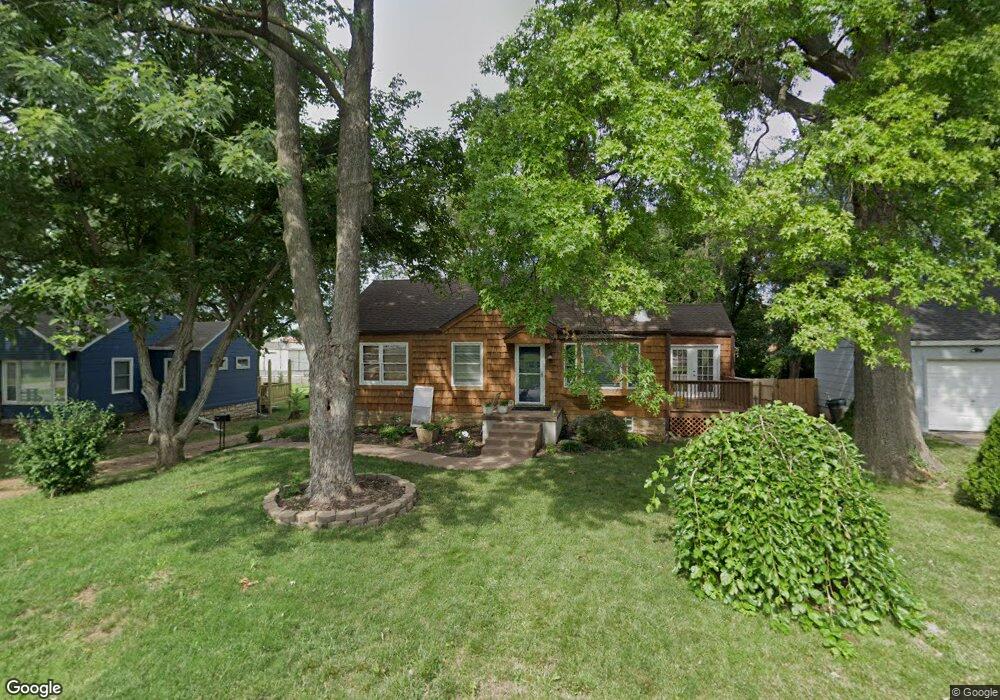
6122 Roger Rd Shawnee, KS 66203
Estimated Value: $247,000 - $285,000
2
Beds
1
Bath
1,114
Sq Ft
$237/Sq Ft
Est. Value
About This Home
This home is located at 6122 Roger Rd, Shawnee, KS 66203 and is currently estimated at $264,301, approximately $237 per square foot. 6122 Roger Rd is a home located in Johnson County with nearby schools including Bluejacket / Flint Elementary, Hocker Grove Middle School, and Shawnee Mission North High School.
Ownership History
Date
Name
Owned For
Owner Type
Purchase Details
Closed on
Sep 3, 2024
Sold by
Cassity Tyler and Cassity Hannah E
Bought by
Blubaugh Luke A and Blubaugh Emily A
Current Estimated Value
Home Financials for this Owner
Home Financials are based on the most recent Mortgage that was taken out on this home.
Original Mortgage
$250,325
Outstanding Balance
$247,672
Interest Rate
6.78%
Mortgage Type
New Conventional
Estimated Equity
$16,629
Purchase Details
Closed on
Jun 18, 2020
Sold by
Vanlerberg Lisa M and Vanlerberg Andrew J
Bought by
Cassity Tyler
Purchase Details
Closed on
Oct 3, 2001
Sold by
Weis Lisa M
Bought by
Weis Lisa M
Home Financials for this Owner
Home Financials are based on the most recent Mortgage that was taken out on this home.
Original Mortgage
$49,600
Interest Rate
6.85%
Create a Home Valuation Report for This Property
The Home Valuation Report is an in-depth analysis detailing your home's value as well as a comparison with similar homes in the area
Home Values in the Area
Average Home Value in this Area
Purchase History
| Date | Buyer | Sale Price | Title Company |
|---|---|---|---|
| Blubaugh Luke A | -- | Continental Title Company | |
| Cassity Tyler | -- | Security 1St Title Llc | |
| Weis Lisa M | $62,000 | Realty Title Co |
Source: Public Records
Mortgage History
| Date | Status | Borrower | Loan Amount |
|---|---|---|---|
| Open | Blubaugh Luke A | $250,325 | |
| Previous Owner | Weis Lisa M | $49,600 |
Source: Public Records
Tax History Compared to Growth
Tax History
| Year | Tax Paid | Tax Assessment Tax Assessment Total Assessment is a certain percentage of the fair market value that is determined by local assessors to be the total taxable value of land and additions on the property. | Land | Improvement |
|---|---|---|---|---|
| 2024 | $2,684 | $25,703 | $5,180 | $20,523 |
| 2023 | $2,471 | $23,138 | $5,180 | $17,958 |
| 2022 | $2,302 | $21,471 | $4,759 | $16,712 |
| 2021 | $2,241 | $19,458 | $4,137 | $15,321 |
| 2020 | $2,115 | $18,112 | $3,757 | $14,355 |
| 2019 | $2,133 | $17,158 | $3,135 | $14,023 |
| 2018 | $1,688 | $13,272 | $2,818 | $10,454 |
| 2017 | $1,671 | $12,938 | $2,818 | $10,120 |
| 2016 | $1,482 | $11,213 | $2,818 | $8,395 |
| 2015 | $1,387 | $11,041 | $2,818 | $8,223 |
| 2013 | -- | $10,788 | $2,818 | $7,970 |
Source: Public Records
Map
Nearby Homes
- 6420 Ballentine St
- 10103 Johnson Dr
- 11002 W 55th Terrace
- 10924 W 67th St
- Ashwood Plan at Bristol Highlands - North
- The Fleetwood Plan at Bristol Highlands - The Villas
- Cypress II Plan at Bristol Highlands - North
- The Fleetwood Plan at Bristol Highlands - The Manors
- The Brentwood Plan at Bristol Highlands - The Villas
- Yorkshire V Plan at Bristol Highlands - North
- The Kirkwood Plan at Bristol Highlands - The Villas
- 8013 Payne St
- The Rockwood Plan at Bristol Highlands - The Villas
- Magnolia Plan at Bristol Highlands - North
- 12116 W 63rd Terrace
- 5933 Knox Ave
- 5845 Caenen St
- 11637 W 68th Terrace
- 12225 W 64th Terrace
- 6610 Halsey St