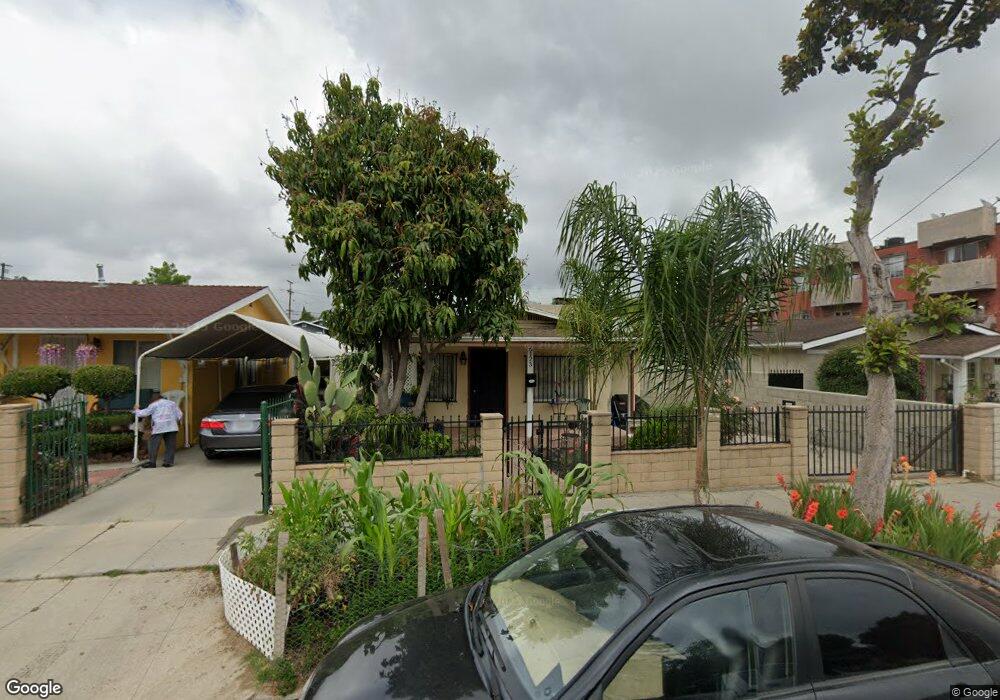
6123 Roy St Los Angeles, CA 90042
Highland Park NeighborhoodEstimated Value: $630,000 - $958,000
4
Beds
1
Bath
890
Sq Ft
$939/Sq Ft
Est. Value
About This Home
This home is located at 6123 Roy St, Los Angeles, CA 90042 and is currently estimated at $835,715, approximately $939 per square foot. 6123 Roy St is a home located in Los Angeles County with nearby schools including Garvanza Elementary, Yorkdale Elementary, and Franklin Middle School & High School.
Ownership History
Date
Name
Owned For
Owner Type
Purchase Details
Closed on
Oct 30, 2024
Sold by
Pantoja Ramiro and Pantoja Rosalba
Bought by
Pantoja Family Trust and Pantoja
Current Estimated Value
Purchase Details
Closed on
Apr 1, 1994
Sold by
Emc Mtg Corp
Bought by
Pantoja Ramiro and Pantoja Rosalba
Home Financials for this Owner
Home Financials are based on the most recent Mortgage that was taken out on this home.
Original Mortgage
$114,315
Interest Rate
8.52%
Mortgage Type
FHA
Purchase Details
Closed on
Mar 24, 1994
Sold by
Great Western Bank Fsb
Bought by
Emc Mtg Corp
Home Financials for this Owner
Home Financials are based on the most recent Mortgage that was taken out on this home.
Original Mortgage
$114,315
Interest Rate
8.52%
Mortgage Type
FHA
Purchase Details
Closed on
Aug 20, 1993
Sold by
California Reconveyance Company
Bought by
Great Western Bank
Create a Home Valuation Report for This Property
The Home Valuation Report is an in-depth analysis detailing your home's value as well as a comparison with similar homes in the area
Home Values in the Area
Average Home Value in this Area
Purchase History
| Date | Buyer | Sale Price | Title Company |
|---|---|---|---|
| Pantoja Family Trust | -- | None Listed On Document | |
| Pantoja Family Trust | -- | None Listed On Document | |
| Pantoja Ramiro | $115,000 | Fidelity National Title Ins | |
| Emc Mtg Corp | -- | Fidelity National Title | |
| Great Western Bank | $96,398 | Chicago Title Company |
Source: Public Records
Mortgage History
| Date | Status | Borrower | Loan Amount |
|---|---|---|---|
| Previous Owner | Pantoja Ramiro | $114,315 |
Source: Public Records
Tax History
| Year | Tax Paid | Tax Assessment Tax Assessment Total Assessment is a certain percentage of the fair market value that is determined by local assessors to be the total taxable value of land and additions on the property. | Land | Improvement |
|---|---|---|---|---|
| 2025 | $2,427 | $195,426 | $156,185 | $39,241 |
| 2024 | $2,427 | $191,595 | $153,123 | $38,472 |
| 2023 | $2,382 | $187,839 | $150,121 | $37,718 |
| 2022 | $2,272 | $184,157 | $147,178 | $36,979 |
| 2021 | $2,240 | $180,547 | $144,293 | $36,254 |
| 2019 | $2,173 | $175,194 | $140,014 | $35,180 |
| 2018 | $2,095 | $171,760 | $137,269 | $34,491 |
| 2016 | $1,992 | $165,092 | $131,940 | $33,152 |
| 2015 | $1,963 | $162,614 | $129,959 | $32,655 |
| 2014 | $1,976 | $159,430 | $127,414 | $32,016 |
Source: Public Records
Map
Nearby Homes
- 6072 Delphi St
- 549 Meridian Terrace
- 6002 Springvale Dr
- 6017 La Prada St
- 355 Newland St
- 6849 N Figueroa St
- 6050 Burwood Ave
- 1083 Milwaukee Ave
- 252 Branch St
- 248 Branch St
- 6150 Strickland Ave
- 1522 N Mercury Dr
- 329 Marie Ave
- 5850 Burwood Ave
- 1425 Highgate Ave
- 6072 York Blvd
- 1124 Highgrove Terrace
- 6162 Annan Way
- 6178 Aldama St
- 1465 Washburn Rd
Your Personal Tour Guide
Ask me questions while you tour the home.