Estimated Value: $136,000 - $193,000
2
Beds
1
Bath
960
Sq Ft
$170/Sq Ft
Est. Value
About This Home
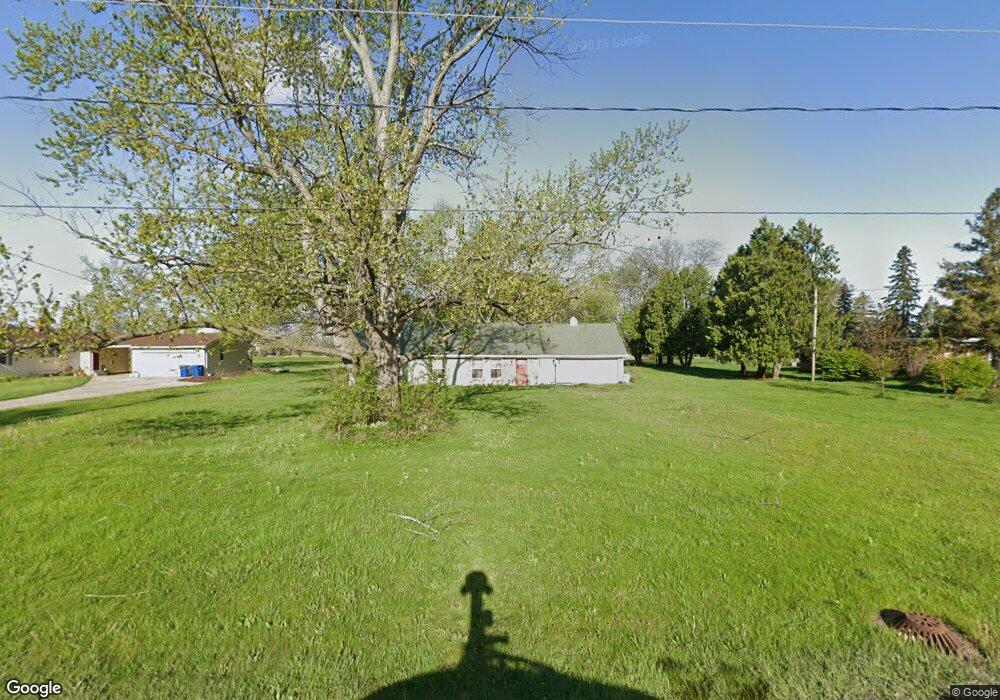
This home is located at 6124 Torrey Rd, Flint, MI 48507 and is currently estimated at $163,047, approximately $169 per square foot. 6124 Torrey Rd is a home located in Genesee County with nearby schools including Elms Road Elementary School, Syring Elementary School, and Morrish Elementary School.
Ownership History
Date
Name
Owned For
Owner Type
Purchase Details
Closed on
Jul 1, 2010
Sold by
Bac Home Loans Servicing Lp
Bought by
Federal National Mortgage Association
Current Estimated Value
Purchase Details
Closed on
Jun 9, 2010
Sold by
Pierce Gary and Pierce Diane
Bought by
Bac Home Loans Servicing Lp
Purchase Details
Closed on
Feb 10, 2004
Sold by
Gould Alice M and Alice M Gould Revocable Trust
Bought by
Pierce Gary and Pierce Diane
Home Financials for this Owner
Home Financials are based on the most recent Mortgage that was taken out on this home.
Original Mortgage
$39,350
Interest Rate
5.65%
Mortgage Type
Purchase Money Mortgage
Purchase Details
Closed on
Dec 19, 2003
Sold by
Gould Alice M and Gould Arlo W
Bought by
Gould Alice M and Revocable Trust Agreement Of A
Home Financials for this Owner
Home Financials are based on the most recent Mortgage that was taken out on this home.
Original Mortgage
$39,350
Interest Rate
5.65%
Mortgage Type
Purchase Money Mortgage
Create a Home Valuation Report for This Property
The Home Valuation Report is an in-depth analysis detailing your home's value as well as a comparison with similar homes in the area
Home Values in the Area
Average Home Value in this Area
Purchase History
| Date | Buyer | Sale Price | Title Company |
|---|---|---|---|
| Federal National Mortgage Association | -- | Attorneys Title Agency Llc | |
| Bac Home Loans Servicing Lp | $39,284 | None Available | |
| Pierce Gary | $34,700 | Title Source Inc | |
| Gould Alice M | -- | -- |
Source: Public Records
Mortgage History
| Date | Status | Borrower | Loan Amount |
|---|---|---|---|
| Previous Owner | Pierce Gary | $39,350 |
Source: Public Records
Tax History
| Year | Tax Paid | Tax Assessment Tax Assessment Total Assessment is a certain percentage of the fair market value that is determined by local assessors to be the total taxable value of land and additions on the property. | Land | Improvement |
|---|---|---|---|---|
| 2025 | $1,931 | $50,400 | $0 | $0 |
| 2024 | $1,303 | $47,300 | $0 | $0 |
| 2023 | $1,242 | $40,900 | $0 | $0 |
| 2022 | $1,692 | $37,400 | $0 | $0 |
| 2021 | $1,659 | $35,700 | $0 | $0 |
| 2020 | $1,139 | $34,300 | $0 | $0 |
| 2019 | $1,120 | $32,600 | $0 | $0 |
| 2018 | $1,419 | $30,100 | $0 | $0 |
| 2017 | $1,365 | $27,700 | $0 | $0 |
| 2016 | $1,351 | $26,600 | $0 | $0 |
| 2015 | $760 | $25,600 | $0 | $0 |
| 2014 | $487 | $24,700 | $0 | $0 |
| 2012 | -- | $24,300 | $24,300 | $0 |
Source: Public Records
Map
Nearby Homes
- 2502 Hutchinson Ln
- 5131 Gateway Centre Blvd
- 6042 Birch Dr
- 0 Taylor Dr Unit 50159493
- 5366 van Slyke Rd
- 7192 Torrey Rd
- 2051 W Maple Ave
- 6095 Weyerbacher Dr
- 0000 Torrey Rd
- 00 Torrey Rd
- 6123 King Arthur Dr
- 4462 Westmont Dr
- 1283 Woodnoll Dr
- 1195 Alton Ave
- 7476 Torrey Rd
- 1395 Windwood Ln
- 1178 Alton Ave
- 6062 Crooked River Dr
- 1380 Sunset Blvd
- 1389 Dellmont Dr
- 6136 Torrey Rd
- 6106 Torrey Rd
- 6094 Torrey Rd Unit Bldg-Unit
- 6094 Torrey Rd
- 6135 Torrey Rd
- 6084 Torrey Rd
- 6155 Torrey Rd
- 6103 Torrey Rd
- 6097 Torrey Rd
- 6173 Torrey Rd
- 6186 Torrey Rd
- 6083 Torrey Rd
- 2499 Hutchinson Ln
- 2486 Hutchinson Ln
- 2486 Hutchinson Ln
- 6196 Torrey Rd
- 6060 Torrey Rd, Suit W Reid Rd
- 6071 Torrey Rd
- 6187 Torrey Rd
- 6174 Mckenzie Dr
Your Personal Tour Guide
Ask me questions while you tour the home.