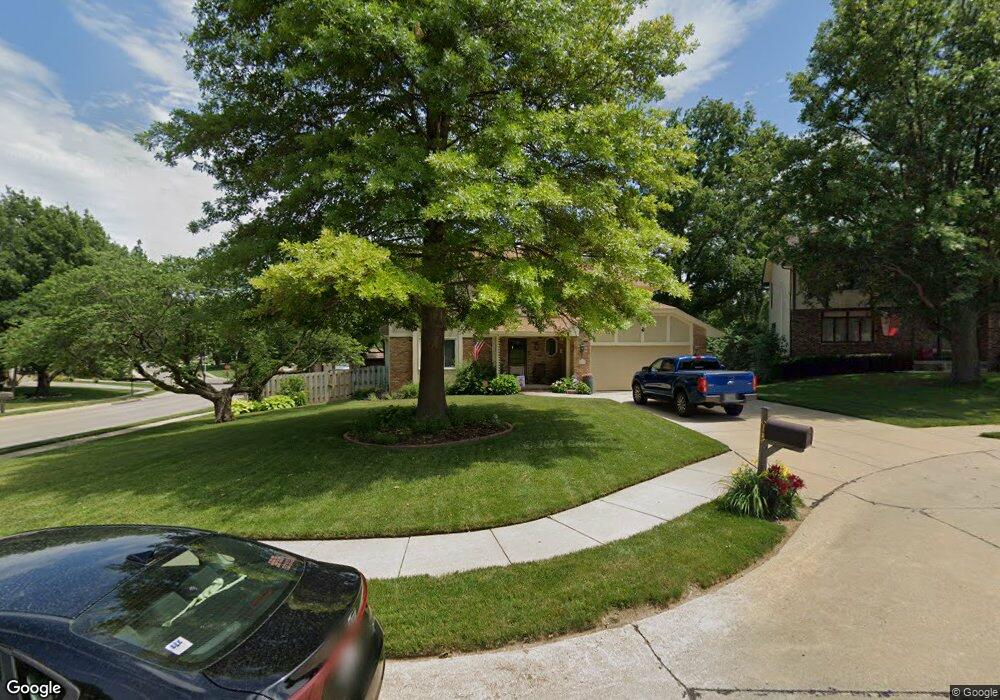
613 Dearborn Cir Papillion, NE 68046
Estimated Value: $379,971 - $388,000
4
Beds
6
Baths
2,901
Sq Ft
$133/Sq Ft
Est. Value
About This Home
This home is located at 613 Dearborn Cir, Papillion, NE 68046 and is currently estimated at $384,493, approximately $132 per square foot. 613 Dearborn Cir is a home located in Sarpy County with nearby schools including Hickory Hill Elementary School, La Vista Middle School, and Papillion La Vista Senior High School.
Ownership History
Date
Name
Owned For
Owner Type
Purchase Details
Closed on
Jun 24, 2004
Sold by
Warren Terry E and Warren Kathleen C
Bought by
Hermanson Kenneth A and Hermanson Dorothy N
Current Estimated Value
Home Financials for this Owner
Home Financials are based on the most recent Mortgage that was taken out on this home.
Original Mortgage
$192,100
Interest Rate
6.3%
Create a Home Valuation Report for This Property
The Home Valuation Report is an in-depth analysis detailing your home's value as well as a comparison with similar homes in the area
Home Values in the Area
Average Home Value in this Area
Purchase History
| Date | Buyer | Sale Price | Title Company |
|---|---|---|---|
| Hermanson Kenneth A | $186,000 | -- |
Source: Public Records
Mortgage History
| Date | Status | Borrower | Loan Amount |
|---|---|---|---|
| Closed | Hermanson Kenneth A | $192,100 |
Source: Public Records
Tax History Compared to Growth
Tax History
| Year | Tax Paid | Tax Assessment Tax Assessment Total Assessment is a certain percentage of the fair market value that is determined by local assessors to be the total taxable value of land and additions on the property. | Land | Improvement |
|---|---|---|---|---|
| 2025 | $4,922 | $342,506 | $52,000 | $290,506 |
| 2024 | $5,687 | $329,975 | $48,000 | $281,975 |
| 2023 | $5,687 | $302,001 | $48,000 | $254,001 |
| 2022 | $5,366 | $262,957 | $39,000 | $223,957 |
| 2021 | $5,277 | $253,496 | $38,000 | $215,496 |
| 2020 | $5,152 | $245,002 | $34,000 | $211,002 |
| 2019 | $4,926 | $234,425 | $34,000 | $200,425 |
| 2018 | $4,858 | $227,663 | $31,000 | $196,663 |
| 2017 | $4,561 | $213,783 | $31,000 | $182,783 |
| 2016 | $4,393 | $206,231 | $31,000 | $175,231 |
| 2015 | $4,293 | $202,101 | $28,000 | $174,101 |
| 2014 | $4,183 | $195,626 | $28,000 | $167,626 |
| 2012 | -- | $197,012 | $28,000 | $169,012 |
Source: Public Records
Map
Nearby Homes
- 815 Kilkinny Cir
- 813 Waterford Cir
- 815 Tipperary Dr
- 810 Oak Ridge Rd
- 812 Oak Ridge Rd
- 813 Janes View St
- 820 Oakland Ln
- 804 Valentine Ln
- 922 Hogan Dr
- 720 Leprechaun Ln
- 1310 Edgewood Blvd
- 714 Donegal Dr
- 1010 Hogan Dr
- 1007 Hogan Dr
- 1020 E Cary St
- 1113 Creighton Rd
- 1101 Roland Dr
- 908 Wicklow Rd
- 7712 Cottonwood Ave
- 7713 Cottonwood Ave
- 611 Dearborn Cir
- 703 Edgewood Blvd
- 702 Edgewood Blvd
- 705 Edgewood Blvd
- 609 Dearborn Cir
- 603 Dearborn Cir
- 606 Edgewood Blvd
- 704 Edgewood Blvd
- 605 Dearborn Cir
- 607 Dearborn Cir
- 604 Edgewood Blvd
- 707 Edgewood Blvd
- 706 Edgewood Blvd
- 601 Edgewood Blvd
- 906 Leprechaun Ln
- 1001 N Beadle St
- 908 Leprechaun Ln
- 913 N Beadle St
- 1003 N Beadle St
- 911 N Beadle St