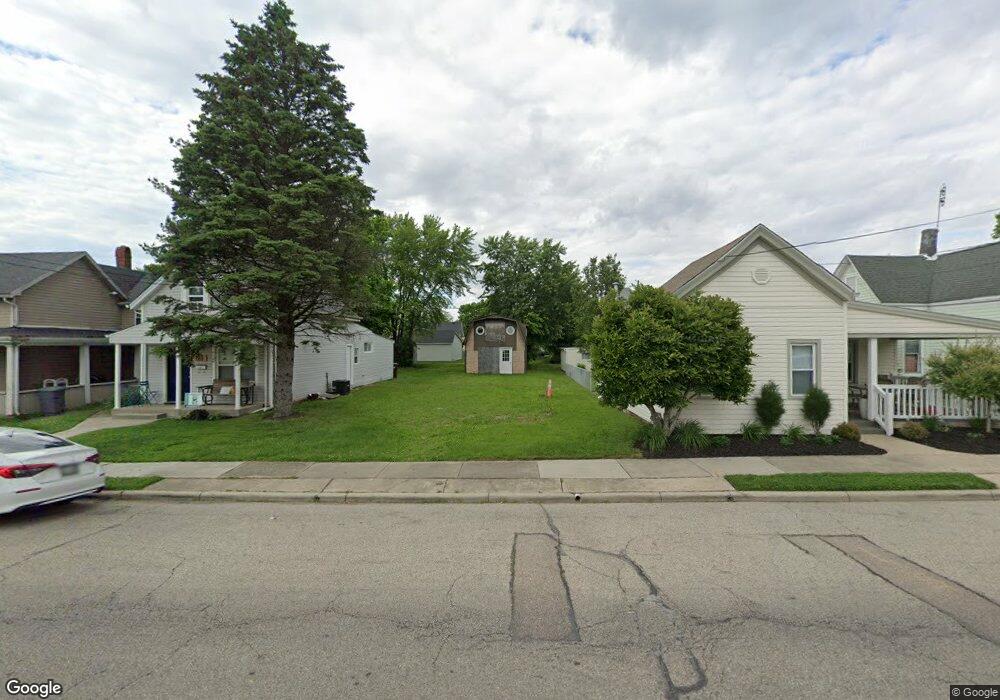
613 E Broadway St Harrison, OH 45030
Estimated Value: $68,000 - $132,000
2
Beds
1
Bath
1,058
Sq Ft
$103/Sq Ft
Est. Value
About This Home
This home is located at 613 E Broadway St, Harrison, OH 45030 and is currently estimated at $108,844, approximately $102 per square foot. 613 E Broadway St is a home located in Hamilton County with nearby schools including William Henry Harrison High School, St. John The Baptist School, and Summit Academy of Southwest Ohio.
Ownership History
Date
Name
Owned For
Owner Type
Purchase Details
Closed on
Feb 28, 2020
Sold by
Pierce Vincent E
Bought by
Lane Terrance A
Current Estimated Value
Purchase Details
Closed on
Dec 16, 2008
Sold by
Secretary Of Housing & Urban Development
Bought by
Pierce Vincent E
Purchase Details
Closed on
Oct 29, 2007
Sold by
Nevels Ancil E
Bought by
Hud
Purchase Details
Closed on
Oct 17, 1997
Sold by
Helcher Daniel M and Schum Mark S
Bought by
Nevels Ancil E
Home Financials for this Owner
Home Financials are based on the most recent Mortgage that was taken out on this home.
Original Mortgage
$54,250
Interest Rate
7.65%
Purchase Details
Closed on
Feb 28, 1997
Sold by
Grubbs Margaret C
Bought by
Helcher Daniel M and Schum Mark S
Create a Home Valuation Report for This Property
The Home Valuation Report is an in-depth analysis detailing your home's value as well as a comparison with similar homes in the area
Home Values in the Area
Average Home Value in this Area
Purchase History
| Date | Buyer | Sale Price | Title Company |
|---|---|---|---|
| Lane Terrance A | $10,000 | None Available | |
| Pierce Vincent E | $26,000 | Lakeside Title & Escrow Agen | |
| Hud | $50,000 | None Available | |
| Nevels Ancil E | $55,000 | -- | |
| Nevels Ancil E | $55,000 | -- | |
| Helcher Daniel M | $45,000 | -- |
Source: Public Records
Mortgage History
| Date | Status | Borrower | Loan Amount |
|---|---|---|---|
| Previous Owner | Nevels Ancil E | $54,250 |
Source: Public Records
Tax History
| Year | Tax Paid | Tax Assessment Tax Assessment Total Assessment is a certain percentage of the fair market value that is determined by local assessors to be the total taxable value of land and additions on the property. | Land | Improvement |
|---|---|---|---|---|
| 2025 | $492 | $10,665 | $6,874 | $3,791 |
| 2024 | $503 | $10,665 | $6,874 | $3,791 |
| 2023 | $497 | $10,665 | $6,874 | $3,791 |
| 2022 | $550 | $10,374 | $6,874 | $3,500 |
| 2021 | $555 | $10,374 | $6,874 | $3,500 |
| 2020 | $548 | $10,374 | $6,874 | $3,500 |
| 2019 | $1,291 | $23,314 | $5,730 | $17,584 |
| 2018 | $1,297 | $23,314 | $5,730 | $17,584 |
| 2017 | $1,241 | $23,314 | $5,730 | $17,584 |
| 2016 | $433 | $8,646 | $5,443 | $3,203 |
| 2015 | $432 | $8,646 | $5,443 | $3,203 |
| 2014 | $412 | $8,646 | $5,443 | $3,203 |
| 2013 | $437 | $9,101 | $5,730 | $3,371 |
Source: Public Records
Map
Nearby Homes
- 163 Turner Ridge Dr
- 157 Turner Ridge Dr
- 155 Turner Ridge Dr
- 119 Park Ave
- 219 N Walnut St
- 300 Whitewater Dr
- 207 Biddle Ave
- 10419 New Biddinger Rd
- 117 Westfield Dr
- 120 Westfield Dr
- 11136 New Biddinger Rd
- 143 Flintstone Dr
- 23 Harrison Brookville Rd
- 483 Heritage Square
- 10630 New Biddinger Rd
- 10638 New Biddinger Rd
- 398 Legacy Way
- 10648 New Biddinger Rd
- 10655 New Biddinger Rd
- 10803 Stone Ridge Way Unit 15
- 611 E Broadway St
- 615 E Broadway St
- 609 E Broadway St
- 617 E Broadway St
- 607 E Broadway St
- 703 E Broadway St
- 616 Harrison Ave
- 612 Harrison Ave
- 705 E Broadway St
- 700 Harrison Ave
- 610 Harrison Ave
- 707 E Broadway St
- 608 Harrison Ave
- 604 Harrison Ave
- 700 E Broadway St
- 602 Harrison Ave
- 711 E Broadway St
- 600 Harrison Ave
- 701 Harrison Ave
- 702 E Broadway St
Your Personal Tour Guide
Ask me questions while you tour the home.