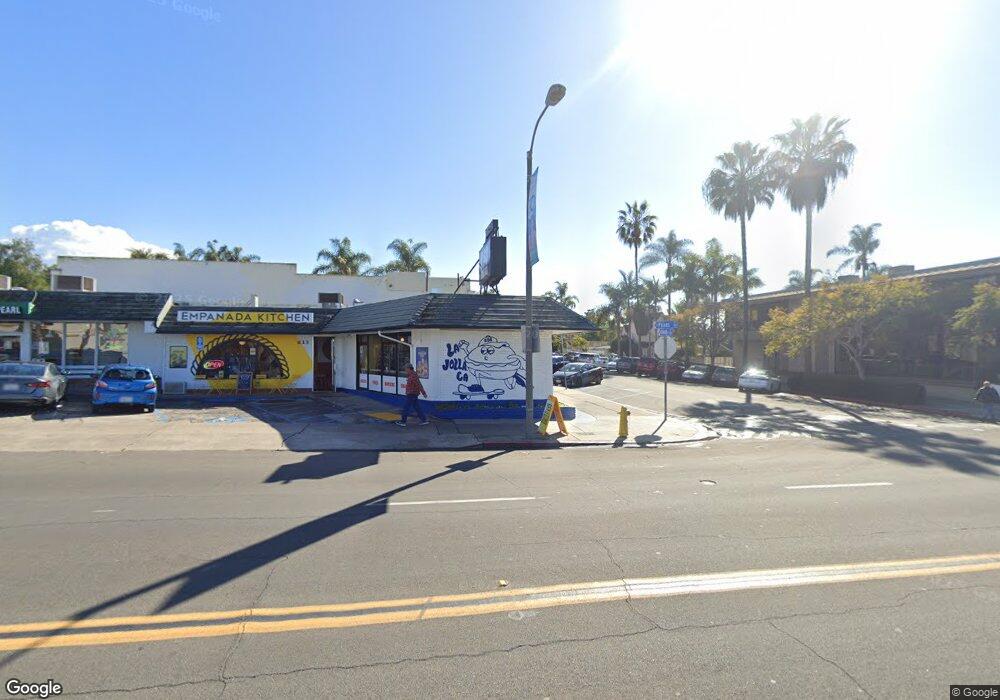
613 Pearl St La Jolla, CA 92037
The Village NeighborhoodEstimated Value: $6,426,466
--
Bed
--
Bath
4,961
Sq Ft
$1,295/Sq Ft
Est. Value
About This Home
This home is located at 613 Pearl St, La Jolla, CA 92037 and is currently estimated at $6,426,466, approximately $1,295 per square foot. 613 Pearl St is a home located in San Diego County with nearby schools including La Jolla Elementary School, Muirlands Middle School, and La Jolla High School.
Ownership History
Date
Name
Owned For
Owner Type
Purchase Details
Closed on
Apr 13, 2012
Sold by
Hom Patricia
Bought by
Hom Gary
Current Estimated Value
Home Financials for this Owner
Home Financials are based on the most recent Mortgage that was taken out on this home.
Original Mortgage
$320,512
Outstanding Balance
$220,858
Interest Rate
3.86%
Mortgage Type
Seller Take Back
Estimated Equity
$6,205,608
Purchase Details
Closed on
Apr 12, 2012
Sold by
Adamov Janice H and Hom Gary M
Bought by
T K Plus Property Holding Llc
Home Financials for this Owner
Home Financials are based on the most recent Mortgage that was taken out on this home.
Original Mortgage
$320,512
Outstanding Balance
$220,858
Interest Rate
3.86%
Mortgage Type
Seller Take Back
Estimated Equity
$6,205,608
Purchase Details
Closed on
Dec 7, 2005
Sold by
Hom Henry M and Hom Gary
Bought by
Hom Gary and Hom Patricia
Purchase Details
Closed on
Jun 25, 1999
Sold by
Hom Wing Yue
Bought by
Hom Wing Yue
Create a Home Valuation Report for This Property
The Home Valuation Report is an in-depth analysis detailing your home's value as well as a comparison with similar homes in the area
Home Values in the Area
Average Home Value in this Area
Purchase History
| Date | Buyer | Sale Price | Title Company |
|---|---|---|---|
| Hom Gary | -- | None Available | |
| T K Plus Property Holding Llc | $2,299,000 | Fidelity National Title Co | |
| Hom Gary | $510,000 | Chicago Title Company | |
| Hom Wing Yue | -- | -- |
Source: Public Records
Mortgage History
| Date | Status | Borrower | Loan Amount |
|---|---|---|---|
| Open | Hom Gary | $320,512 |
Source: Public Records
Tax History Compared to Growth
Tax History
| Year | Tax Paid | Tax Assessment Tax Assessment Total Assessment is a certain percentage of the fair market value that is determined by local assessors to be the total taxable value of land and additions on the property. | Land | Improvement |
|---|---|---|---|---|
| 2025 | $35,539 | $2,887,663 | $2,260,898 | $626,765 |
| 2024 | $35,539 | $2,831,043 | $2,216,567 | $614,476 |
| 2023 | $34,753 | $2,775,533 | $2,173,105 | $602,428 |
| 2022 | $33,827 | $2,721,112 | $2,130,496 | $590,616 |
| 2021 | $33,580 | $2,667,758 | $2,088,722 | $579,036 |
| 2020 | $33,180 | $2,640,404 | $2,067,305 | $573,099 |
| 2019 | $32,600 | $2,588,632 | $2,026,770 | $561,862 |
| 2018 | $29,839 | $2,537,876 | $1,987,030 | $550,846 |
| 2017 | $29,810 | $2,488,115 | $1,948,069 | $540,046 |
| 2016 | $28,673 | $2,439,329 | $1,909,872 | $529,457 |
| 2015 | $28,249 | $2,402,689 | $1,881,184 | $521,505 |
| 2014 | $27,800 | $2,355,625 | $1,844,335 | $511,290 |
Source: Public Records
Map
Nearby Homes
- 7520 Draper Ave Unit 3
- 7560 Eads Ave Unit 12
- 726 Silver St
- 708 Silver St
- 718 Silver St
- 7372 Fay Ave
- 7376 Fay Ave
- 609 Genter St
- 7601 Eads Ave
- 7635 Draper Ave Unit LU4
- 230 Prospect St Unit 12
- 302 Prospect St Unit 6
- 302 Prospect St Unit 7
- 716 Glenview Ln
- 7355 Fay Ave
- 229 Coast Blvd Unit U1
- 7310 Fay Ave
- 265 Coast Blvd Unit 9
- 202 Coast Blvd Unit 4
- 357 Coast Blvd S
- 7467 Cuvier St
- 7461 Cuvier St Unit 63
- 7458 Draper Ave Unit 60
- 7453 Cuvier St
- 7455 Cuvier St
- 7437 Cuvier St
- 7454 Draper Ave
- 7452 Draper Ave
- 7456 Draper Ave
- 7510 - 7516 1/2 Draper Ave
- 7460 1/2 Cuvier St
- 7516 Draper Ave
- 7510 Draper Ave
- 7435 Cuvier St
- 7454 Cuvier St Unit 12
- 7446 Draper Ave
- 7446 Cuvier St Unit 50
- 7512 Draper Ave
- 7510 Draper Ave
- 7516 1/2 Draper Ave