Estimated Value: $2,029,265
--
Bed
--
Bath
6,000
Sq Ft
$338/Sq Ft
Est. Value
About This Home
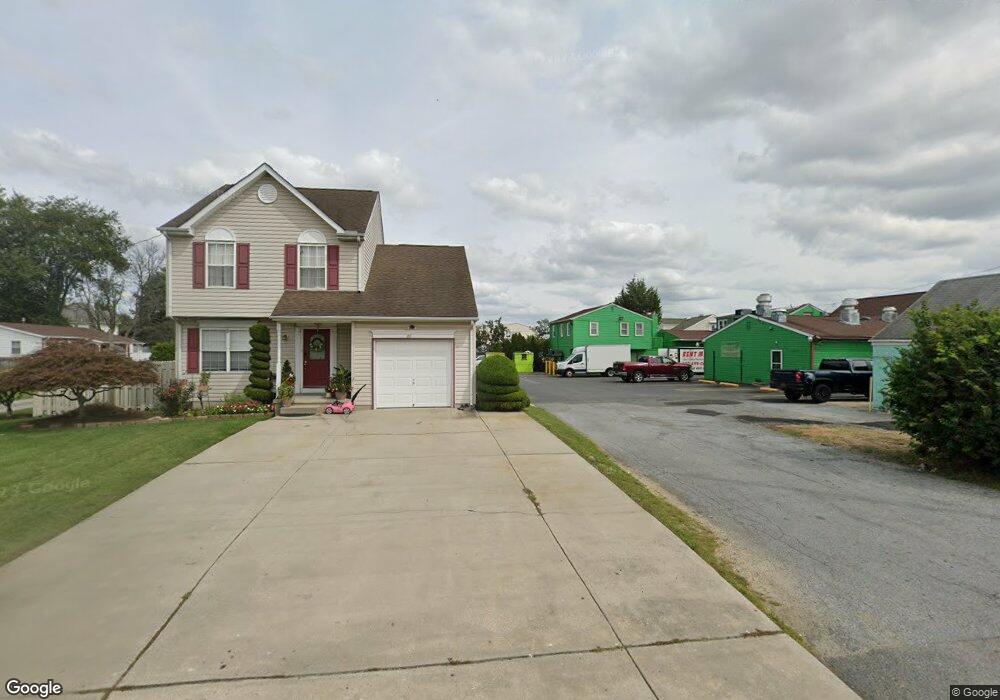
This home is located at 613 Pulaski Hwy, Bear, DE 19701 and is currently estimated at $2,029,265, approximately $338 per square foot. 613 Pulaski Hwy is a home located in New Castle County with nearby schools including Kathleen H. Wilbur Elementary School, Gunning Bedford Middle School, and Fairwinds Christian School.
Ownership History
Date
Name
Owned For
Owner Type
Purchase Details
Closed on
Aug 28, 2025
Sold by
Two Farms Inc
Bought by
Two Farms Inc
Current Estimated Value
Purchase Details
Closed on
Jun 30, 2025
Sold by
Ibanez Cisar E and Sanabria Ericka L
Bought by
Two Farms Inc
Purchase Details
Closed on
Jul 31, 2023
Sold by
613 Properties Llc
Bought by
Two Farms Inc
Purchase Details
Closed on
Apr 15, 2020
Sold by
613 Properties Llc
Bought by
Wilson Virginia L and Wilson Robert L
Purchase Details
Closed on
Jun 25, 2008
Sold by
Landgraf Real Estate Llc
Bought by
613 Properties Llc
Home Financials for this Owner
Home Financials are based on the most recent Mortgage that was taken out on this home.
Original Mortgage
$575,000
Interest Rate
6.17%
Mortgage Type
Commercial
Create a Home Valuation Report for This Property
The Home Valuation Report is an in-depth analysis detailing your home's value as well as a comparison with similar homes in the area
Home Values in the Area
Average Home Value in this Area
Purchase History
| Date | Buyer | Sale Price | Title Company |
|---|---|---|---|
| Two Farms Inc | -- | None Listed On Document | |
| Two Farms Inc | $275,000 | None Listed On Document | |
| Two Farms Inc | -- | None Listed On Document | |
| Wilson Virginia L | -- | None Available | |
| 613 Properties Llc | $1,200,000 | None Available |
Source: Public Records
Mortgage History
| Date | Status | Borrower | Loan Amount |
|---|---|---|---|
| Previous Owner | 613 Properties Llc | $575,000 |
Source: Public Records
Tax History Compared to Growth
Tax History
| Year | Tax Paid | Tax Assessment Tax Assessment Total Assessment is a certain percentage of the fair market value that is determined by local assessors to be the total taxable value of land and additions on the property. | Land | Improvement |
|---|---|---|---|---|
| 2024 | $2,588 | $77,600 | $53,200 | $24,400 |
| 2023 | $2,377 | $77,600 | $53,200 | $24,400 |
| 2022 | $2,460 | $77,600 | $53,200 | $24,400 |
| 2021 | $7,260 | $77,600 | $53,200 | $24,400 |
| 2020 | $3,049 | $77,600 | $53,200 | $24,400 |
| 2019 | $2,472 | $77,600 | $53,200 | $24,400 |
| 2018 | $2,426 | $77,600 | $53,200 | $24,400 |
| 2017 | $2,266 | $77,600 | $53,200 | $24,400 |
| 2016 | $2,200 | $77,600 | $53,200 | $24,400 |
| 2015 | $2,025 | $77,600 | $53,200 | $24,400 |
| 2014 | $2,027 | $77,600 | $53,200 | $24,400 |
Source: Public Records
Map
Nearby Homes
- 734 Pulaski Hwy Unit 30
- 719 Cardinal Ave
- 1098 Old Forge Rd
- 13 Denise Ct
- 203 Shorewind Rd
- 1209 Canvasback Dr
- 410 Ashton Ln
- 416 Ashton Ln Unit 416
- 7 Brian Ct
- 201 Dasher Ct
- 24 Ashley Dr
- 613 Willings Way
- 810 Willings Way
- 68 Liborio Ln
- 5 Liborio Ln
- 6 Harpers Place
- 20 Dorsey Ln
- 120 Channing Dr
- 17 Lanford Rd
- 216 Highland Blvd Unit 77