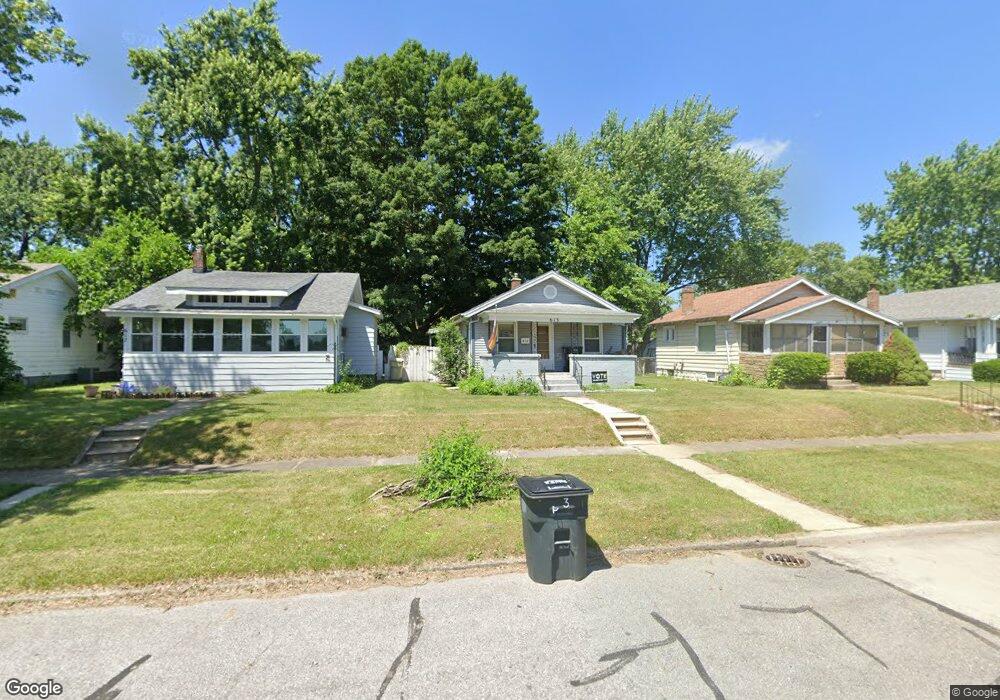
613 S 31st St South Bend, IN 46615
River Park NeighborhoodEstimated Value: $122,000 - $151,000
2
Beds
1
Bath
880
Sq Ft
$152/Sq Ft
Est. Value
About This Home
This home is located at 613 S 31st St, South Bend, IN 46615 and is currently estimated at $133,966, approximately $152 per square foot. 613 S 31st St is a home located in St. Joseph County with nearby schools including Cora B. Darling Elementary School, Nuner Fine Arts Academy, and Clay Intermediate Center.
Ownership History
Date
Name
Owned For
Owner Type
Purchase Details
Closed on
Apr 3, 2021
Sold by
Bradbury Brett A
Bought by
Bradbury Heather A
Current Estimated Value
Purchase Details
Closed on
Apr 13, 2006
Sold by
Ganger Andrew R
Bought by
Bradbury Brett A and Bradbury Heather A
Home Financials for this Owner
Home Financials are based on the most recent Mortgage that was taken out on this home.
Original Mortgage
$79,192
Outstanding Balance
$45,823
Interest Rate
6.48%
Mortgage Type
FHA
Estimated Equity
$88,143
Create a Home Valuation Report for This Property
The Home Valuation Report is an in-depth analysis detailing your home's value as well as a comparison with similar homes in the area
Home Values in the Area
Average Home Value in this Area
Purchase History
| Date | Buyer | Sale Price | Title Company |
|---|---|---|---|
| Bradbury Heather A | -- | None Available | |
| Bradbury Brett A | -- | None Available |
Source: Public Records
Mortgage History
| Date | Status | Borrower | Loan Amount |
|---|---|---|---|
| Open | Bradbury Brett A | $79,192 |
Source: Public Records
Tax History Compared to Growth
Tax History
| Year | Tax Paid | Tax Assessment Tax Assessment Total Assessment is a certain percentage of the fair market value that is determined by local assessors to be the total taxable value of land and additions on the property. | Land | Improvement |
|---|---|---|---|---|
| 2024 | $960 | $88,000 | $6,100 | $81,900 |
| 2023 | $917 | $83,500 | $6,100 | $77,400 |
| 2022 | $794 | $71,900 | $6,100 | $65,800 |
| 2021 | $798 | $69,500 | $3,900 | $65,600 |
| 2020 | $1,037 | $89,100 | $3,300 | $85,800 |
| 2019 | $843 | $80,000 | $2,700 | $77,300 |
| 2018 | $789 | $69,600 | $2,300 | $67,300 |
| 2017 | $800 | $68,800 | $2,300 | $66,500 |
| 2016 | $810 | $68,800 | $2,300 | $66,500 |
| 2014 | $758 | $67,500 | $2,300 | $65,200 |
Source: Public Records
Map
Nearby Homes
- 734 S 33rd St
- 3312 E Jefferson Square
- 525 S 28th St
- 715 S 35th St
- 537 S 27th St
- 1105 S 35th St
- 634 S 26th St
- 513 S 26th St
- 741 S 36th St
- 806 S 26th St
- 3312 Mishawaka Ave
- 815 S 26th St
- 3517 Mishawaka Ave
- 930 S 34th St
- 110 S 33rd St
- 1019 W Lawrence St
- 910 W Lawrence St
- 1111 S 27th St
- 510 S Ironwood Dr
- 910 W Borley Ave