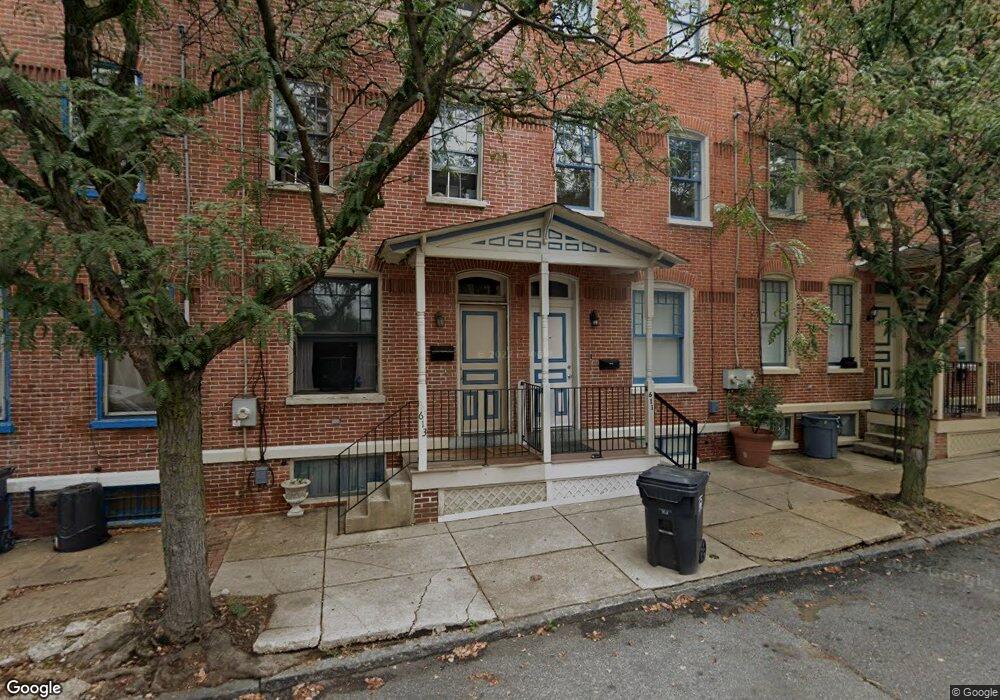
613 W 9th St Wilmington, DE 19801
Downtown Wilmington NeighborhoodEstimated Value: $234,553 - $307,000
3
Beds
1
Bath
1,392
Sq Ft
$194/Sq Ft
Est. Value
About This Home
This home is located at 613 W 9th St, Wilmington, DE 19801 and is currently estimated at $270,388, approximately $194 per square foot. 613 W 9th St is a home located in New Castle County with nearby schools including The Bayard School, Christiana High School, and Freire Charter School.
Ownership History
Date
Name
Owned For
Owner Type
Purchase Details
Closed on
Jun 8, 2005
Sold by
Nock Cynthia D
Bought by
Wright Shawn N and Wing Crystal R
Current Estimated Value
Home Financials for this Owner
Home Financials are based on the most recent Mortgage that was taken out on this home.
Original Mortgage
$119,920
Outstanding Balance
$71,822
Interest Rate
7.2%
Mortgage Type
Purchase Money Mortgage
Estimated Equity
$150,610
Create a Home Valuation Report for This Property
The Home Valuation Report is an in-depth analysis detailing your home's value as well as a comparison with similar homes in the area
Home Values in the Area
Average Home Value in this Area
Purchase History
| Date | Buyer | Sale Price | Title Company |
|---|---|---|---|
| Wright Shawn N | $149,900 | -- |
Source: Public Records
Mortgage History
| Date | Status | Borrower | Loan Amount |
|---|---|---|---|
| Open | Wright Shawn N | $119,920 | |
| Closed | Wright Shawn N | $29,980 | |
| Previous Owner | Mccoy Cynthia | $3,020,000 |
Source: Public Records
Tax History Compared to Growth
Tax History
| Year | Tax Paid | Tax Assessment Tax Assessment Total Assessment is a certain percentage of the fair market value that is determined by local assessors to be the total taxable value of land and additions on the property. | Land | Improvement |
|---|---|---|---|---|
| 2024 | $1,020 | $32,700 | $6,000 | $26,700 |
| 2023 | $887 | $32,700 | $6,000 | $26,700 |
| 2022 | $891 | $32,700 | $6,000 | $26,700 |
| 2021 | $889 | $32,700 | $6,000 | $26,700 |
| 2020 | $894 | $32,700 | $6,000 | $26,700 |
| 2019 | $1,552 | $32,700 | $6,000 | $26,700 |
| 2018 | $890 | $32,700 | $6,000 | $26,700 |
| 2017 | $889 | $32,700 | $6,000 | $26,700 |
| 2016 | $842 | $32,700 | $6,000 | $26,700 |
| 2015 | $1,386 | $32,700 | $6,000 | $26,700 |
| 2014 | $1,316 | $32,700 | $6,000 | $26,700 |
Source: Public Records
Map
Nearby Homes