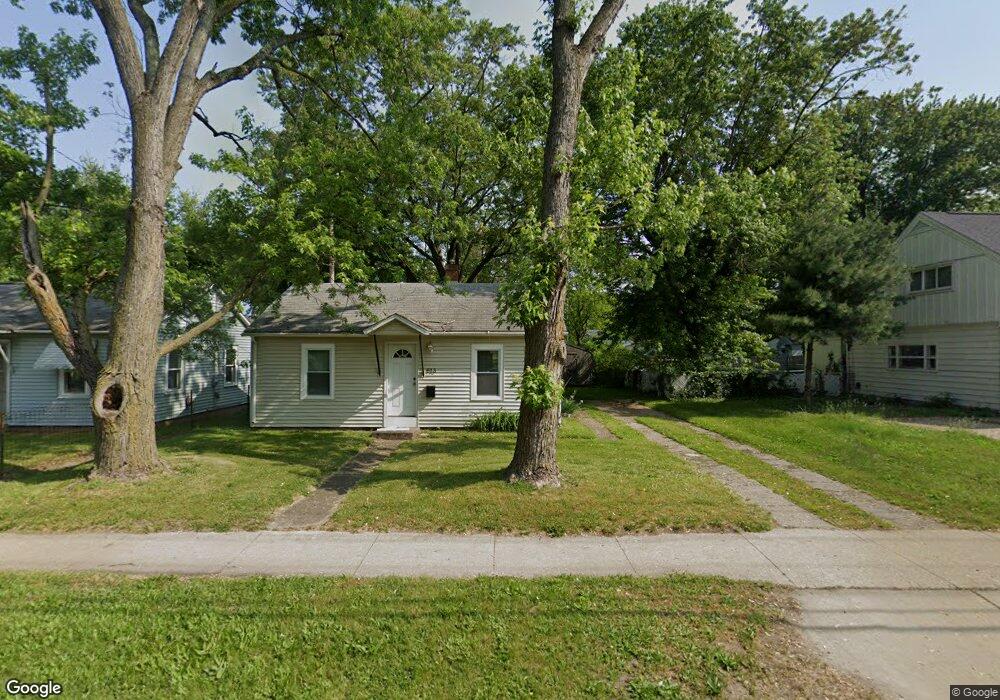
613 W Broadway St Three Rivers, MI 49093
Estimated Value: $100,000 - $117,000
2
Beds
1
Bath
840
Sq Ft
$130/Sq Ft
Est. Value
About This Home
This home is located at 613 W Broadway St, Three Rivers, MI 49093 and is currently estimated at $108,820, approximately $129 per square foot. 613 W Broadway St is a home located in St. Joseph County with nearby schools including Immaculate Conception School and Heartwood Renaissance Academy.
Ownership History
Date
Name
Owned For
Owner Type
Purchase Details
Closed on
Nov 4, 2015
Sold by
Baker Patricia M
Bought by
Baker Patricia M and Baker James F
Current Estimated Value
Purchase Details
Closed on
May 23, 2013
Sold by
Baker James F
Bought by
Baker Patricia M
Home Financials for this Owner
Home Financials are based on the most recent Mortgage that was taken out on this home.
Original Mortgage
$33,660
Outstanding Balance
$23,744
Interest Rate
3.38%
Mortgage Type
New Conventional
Estimated Equity
$85,076
Purchase Details
Closed on
May 29, 2008
Sold by
Baker James F and Baker Patricia M
Bought by
Baker Ii James F
Home Financials for this Owner
Home Financials are based on the most recent Mortgage that was taken out on this home.
Original Mortgage
$30,000
Interest Rate
5.93%
Mortgage Type
New Conventional
Purchase Details
Closed on
Oct 30, 1996
Sold by
Prater Glen and Prater Ruby
Bought by
Baker James F and Baker Patricia M
Purchase Details
Closed on
Aug 7, 1989
Sold by
Prater Glen and Prater Ruby
Bought by
Baker James F and Baker Patricia M
Create a Home Valuation Report for This Property
The Home Valuation Report is an in-depth analysis detailing your home's value as well as a comparison with similar homes in the area
Home Values in the Area
Average Home Value in this Area
Purchase History
| Date | Buyer | Sale Price | Title Company |
|---|---|---|---|
| Baker Patricia M | -- | None Available | |
| Baker Patricia M | $32,000 | Lighthouse Title Inc | |
| Baker Ii James F | -- | Vt | |
| Baker James F | $13,200 | -- | |
| Baker James F | -- | -- |
Source: Public Records
Mortgage History
| Date | Status | Borrower | Loan Amount |
|---|---|---|---|
| Open | Baker Patricia M | $33,660 | |
| Previous Owner | Baker Ii James F | $30,000 |
Source: Public Records
Tax History
| Year | Tax Paid | Tax Assessment Tax Assessment Total Assessment is a certain percentage of the fair market value that is determined by local assessors to be the total taxable value of land and additions on the property. | Land | Improvement |
|---|---|---|---|---|
| 2025 | $596 | $36,400 | $2,900 | $33,500 |
| 2024 | $579 | $33,400 | $2,200 | $31,200 |
| 2023 | $552 | $27,600 | $2,000 | $25,600 |
| 2022 | $526 | $24,400 | $2,100 | $22,300 |
| 2021 | $773 | $23,000 | $1,900 | $21,100 |
| 2020 | $764 | $20,600 | $1,600 | $19,000 |
| 2019 | $749 | $18,300 | $1,400 | $16,900 |
| 2018 | $712 | $18,900 | $4,400 | $14,500 |
| 2017 | $701 | $18,700 | $18,700 | $0 |
| 2016 | -- | $18,300 | $18,300 | $0 |
| 2015 | -- | $15,800 | $0 | $0 |
| 2014 | -- | $15,300 | $15,300 | $0 |
| 2012 | -- | $14,600 | $14,600 | $0 |
Source: Public Records
Map
Nearby Homes
- 911 S Lincoln Ave
- 718 S Douglas Ave
- 815 Swartz St
- 406 Spring St
- 902 Millard St
- 18 & 19 Elizabeth Dr
- 919 4th St
- 1118 Millard Ct
- 306 W Michigan Ave
- 108 N Lincoln Ave
- 106 N Erie St
- 60241 Constantine Rd
- 203 S Main St
- 816 7th St
- 416 River St
- 500 River St
- 11582 Michigan 60
- 132 Middle St
- 108 River Dr
- 111 River Dr
- 617 W Broadway St
- 607 W Broadway St
- 603 W Broadway St
- 701 W Broadway St
- 811 S Lincoln Ave
- 703 W Broadway St
- 604 W Broadway St
- 612 W Broadway St
- 700 W Broadway St
- 809 S Lincoln Ave
- 705 W Broadway St
- 517 W Broadway St
- 801 S Lincoln Ave
- 816 S Lincoln Ave
- 717 W Broadway St
- 514 W Broadway St
- 814 S Lincoln Ave
- 718 W Broadway St
- 806 S Lincoln Ave
- 726 S Grant Ave
Your Personal Tour Guide
Ask me questions while you tour the home.