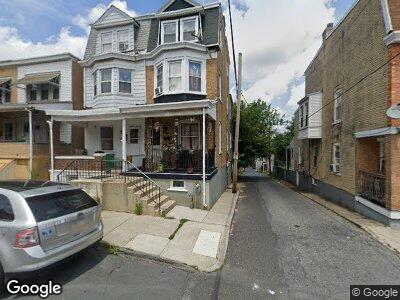
613 W Greenleaf St Allentown, PA 18102
Center City NeighborhoodEstimated Value: $149,686 - $206,000
4
Beds
2
Baths
1,326
Sq Ft
$134/Sq Ft
Est. Value
About This Home
This home is located at 613 W Greenleaf St, Allentown, PA 18102 and is currently estimated at $177,422, approximately $133 per square foot. 613 W Greenleaf St is a home located in Lehigh County with nearby schools including Washington Elementary School, Trexler Middle School, and William Allen High School.
Ownership History
Date
Name
Owned For
Owner Type
Purchase Details
Closed on
Jul 21, 2006
Sold by
Gonzalez Hector J
Bought by
Marcial Miguel
Current Estimated Value
Home Financials for this Owner
Home Financials are based on the most recent Mortgage that was taken out on this home.
Original Mortgage
$88,000
Outstanding Balance
$56,589
Interest Rate
7.62%
Mortgage Type
Purchase Money Mortgage
Estimated Equity
$116,557
Purchase Details
Closed on
Mar 17, 2006
Sold by
Santos Carmen
Bought by
Gonzalez Hector J
Home Financials for this Owner
Home Financials are based on the most recent Mortgage that was taken out on this home.
Original Mortgage
$67,410
Interest Rate
6.4%
Mortgage Type
Fannie Mae Freddie Mac
Purchase Details
Closed on
May 19, 1995
Sold by
Housing Assoc & Devel Corp
Bought by
Santos Carment
Purchase Details
Closed on
Sep 15, 1994
Sold by
Sec Of Housing & Urban Development
Bought by
Housing Assoc & Devel Corp
Purchase Details
Closed on
Feb 25, 1994
Bought by
Sec Of Housing & Urban Development
Create a Home Valuation Report for This Property
The Home Valuation Report is an in-depth analysis detailing your home's value as well as a comparison with similar homes in the area
Home Values in the Area
Average Home Value in this Area
Purchase History
| Date | Buyer | Sale Price | Title Company |
|---|---|---|---|
| Marcial Miguel | $90,000 | None Available | |
| Gonzalez Hector J | $74,900 | None Available | |
| Santos Carment | $50,000 | -- | |
| Housing Assoc & Devel Corp | $17,200 | -- | |
| Sec Of Housing & Urban Development | -- | -- |
Source: Public Records
Mortgage History
| Date | Status | Borrower | Loan Amount |
|---|---|---|---|
| Open | Marcial Miguel | $88,000 | |
| Previous Owner | Gonzalez Hector J | $67,410 |
Source: Public Records
Tax History Compared to Growth
Tax History
| Year | Tax Paid | Tax Assessment Tax Assessment Total Assessment is a certain percentage of the fair market value that is determined by local assessors to be the total taxable value of land and additions on the property. | Land | Improvement |
|---|---|---|---|---|
| 2025 | $1,625 | $50,400 | $3,600 | $46,800 |
| 2024 | $1,625 | $50,400 | $3,600 | $46,800 |
| 2023 | $1,625 | $50,400 | $3,600 | $46,800 |
| 2022 | $1,567 | $50,400 | $46,800 | $3,600 |
| 2021 | $1,536 | $50,400 | $3,600 | $46,800 |
| 2020 | $1,495 | $50,400 | $3,600 | $46,800 |
| 2019 | $1,471 | $50,400 | $3,600 | $46,800 |
| 2018 | $1,375 | $50,400 | $3,600 | $46,800 |
| 2017 | $1,340 | $50,400 | $3,600 | $46,800 |
| 2016 | -- | $50,400 | $3,600 | $46,800 |
| 2015 | -- | $50,400 | $3,600 | $46,800 |
| 2014 | -- | $50,400 | $3,600 | $46,800 |
Source: Public Records
Map
Nearby Homes
- 858 N 7th St
- 824 N 5th St
- 907 N 5th St
- 844 N 8th St
- 733 W Green St
- 737 N 5th St
- 726 N Eighth St
- 836 Elliger St
- 809 W Tilghman St
- 843 W Tilghman St
- 643 N 4th St
- 526 N Law St
- 617 N 9th St
- 392 W Tilghman St
- 617-1/2 N Ninth St
- 734 N Meadow St
- 701 N Jordan St
- 617 W Liberty St
- 828 W Allen St
- 528 W Liberty St
- 613 W Greenleaf St
- 611 W Greenleaf St
- 615 W Greenleaf St
- 609 W Greenleaf St
- 618 W Greenleaf St
- 617 W Greenleaf St
- 607 W Greenleaf St
- 619 W Greenleaf St
- 623 W Greenleaf St
- 911 N Emery St
- 625 W Greenleaf St
- 906 N 6th St
- 904 N 6th St
- 902 1/2 N 6th St
- 908 N 6th St
- 627 W Greenleaf St
- 910 N 6th St
- 912 N 6th St
- 629 W Greenleaf St
- 616 W Greenleaf St