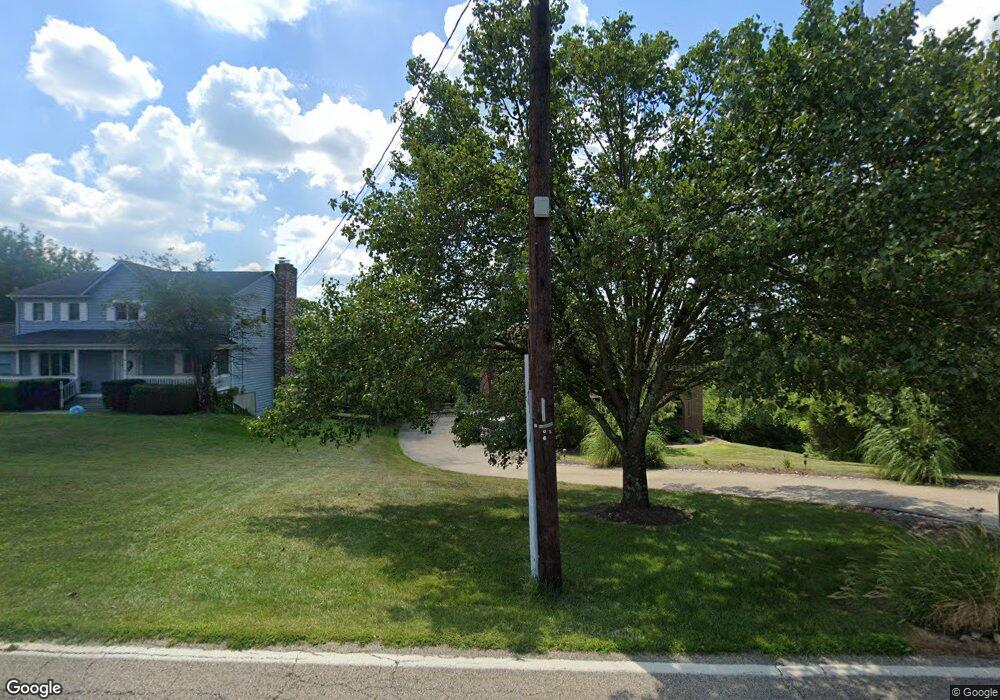
6133 W Fork Rd Cincinnati, OH 45247
Estimated Value: $531,000 - $871,000
4
Beds
3
Baths
2,736
Sq Ft
$237/Sq Ft
Est. Value
About This Home
This home is located at 6133 W Fork Rd, Cincinnati, OH 45247 and is currently estimated at $649,300, approximately $237 per square foot. 6133 W Fork Rd is a home located in Hamilton County with nearby schools including Monfort Heights Elementary School, White Oak Middle School, and Colerain High School.
Ownership History
Date
Name
Owned For
Owner Type
Purchase Details
Closed on
Jan 18, 2022
Sold by
Englert Aimee C
Bought by
Englert Aimee C and Webster Jay L
Current Estimated Value
Purchase Details
Closed on
Jan 5, 2021
Sold by
Englert John G and Englert Aimee C
Bought by
Englert Aimee
Purchase Details
Closed on
Dec 28, 2004
Sold by
Newsom Scott E and Newsom Judith Ann
Bought by
Englert John G and Englert Aimee C
Home Financials for this Owner
Home Financials are based on the most recent Mortgage that was taken out on this home.
Original Mortgage
$300,000
Interest Rate
5.9%
Mortgage Type
Unknown
Create a Home Valuation Report for This Property
The Home Valuation Report is an in-depth analysis detailing your home's value as well as a comparison with similar homes in the area
Home Values in the Area
Average Home Value in this Area
Purchase History
| Date | Buyer | Sale Price | Title Company |
|---|---|---|---|
| Englert Aimee C | $250 | None Listed On Document | |
| Englert Aimee | -- | None Available | |
| Englert John G | $375,000 | -- |
Source: Public Records
Mortgage History
| Date | Status | Borrower | Loan Amount |
|---|---|---|---|
| Previous Owner | Englert John G | $300,000 |
Source: Public Records
Tax History Compared to Growth
Tax History
| Year | Tax Paid | Tax Assessment Tax Assessment Total Assessment is a certain percentage of the fair market value that is determined by local assessors to be the total taxable value of land and additions on the property. | Land | Improvement |
|---|---|---|---|---|
| 2024 | $9,530 | $171,553 | $24,654 | $146,899 |
| 2023 | $9,420 | $171,553 | $24,654 | $146,899 |
| 2022 | $8,280 | $126,746 | $25,886 | $100,860 |
| 2021 | $7,598 | $126,746 | $25,886 | $100,860 |
| 2020 | $7,661 | $126,746 | $25,886 | $100,860 |
| 2019 | $8,055 | $120,712 | $24,654 | $96,058 |
| 2018 | $7,175 | $120,712 | $24,654 | $96,058 |
| 2017 | $6,787 | $120,712 | $24,654 | $96,058 |
| 2016 | $6,433 | $112,606 | $24,409 | $88,197 |
| 2015 | $6,486 | $112,606 | $24,409 | $88,197 |
| 2014 | $6,498 | $112,606 | $24,409 | $88,197 |
| 2013 | $6,138 | $113,743 | $24,654 | $89,089 |
Source: Public Records
Map
Nearby Homes
- 6130 W Fork Rd
- 6251 W Fork Rd
- 6306 W Fork Rd
- 6044 Eden Roc Place
- 5980 Brierly Creek Rd
- 5998 Brierly Ridge Dr
- 5423 Bluesky Dr
- 6163 Sheed Rd
- 5340 Lakefront Dr Unit 5340
- 5801 W Fork Rd
- 5991 Gaines Rd
- 6051 Shelrich Ct
- 6230 Castle Stone Ln
- 5891 Snyder Rd
- 5804 Cedaridge Dr
- 5237 Clearlake Dr Unit 22
- 6676 Daleview Rd
- 5221 Clearlake Dr
- 5207 S Eaglesnest Dr
- 6662 Daleview Rd