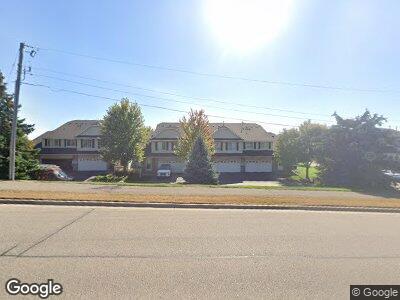
6135 Tahoe Cir Unit C Woodbury, MN 55125
Estimated Value: $260,000 - $287,000
2
Beds
2
Baths
1,408
Sq Ft
$196/Sq Ft
Est. Value
About This Home
This home is located at 6135 Tahoe Cir Unit C, Woodbury, MN 55125 and is currently estimated at $275,569, approximately $195 per square foot. 6135 Tahoe Cir Unit C is a home located in Washington County with nearby schools including Newport Elementary School, Woodbury Middle School, and Woodbury Senior High School.
Ownership History
Date
Name
Owned For
Owner Type
Purchase Details
Closed on
Sep 28, 2021
Sold by
Flalkowski Matthew and Flalkowski Shelby
Bought by
Carlson Steven Marcus and Carlson Denise Lynn
Current Estimated Value
Home Financials for this Owner
Home Financials are based on the most recent Mortgage that was taken out on this home.
Original Mortgage
$145,000
Outstanding Balance
$115,220
Interest Rate
2.15%
Mortgage Type
New Conventional
Estimated Equity
$160,349
Purchase Details
Closed on
Jun 26, 2015
Sold by
Kays Kimberly M
Bought by
Fialkowski Matthew
Home Financials for this Owner
Home Financials are based on the most recent Mortgage that was taken out on this home.
Original Mortgage
$124,000
Interest Rate
3.86%
Mortgage Type
New Conventional
Purchase Details
Closed on
Jun 29, 1998
Sold by
Gm Land Company Inc
Bought by
Gm Homes Inc
Create a Home Valuation Report for This Property
The Home Valuation Report is an in-depth analysis detailing your home's value as well as a comparison with similar homes in the area
Home Values in the Area
Average Home Value in this Area
Purchase History
| Date | Buyer | Sale Price | Title Company |
|---|---|---|---|
| Carlson Steven Marcus | $245,000 | Burnet Title | |
| Fialkowski Matthew | $155,000 | Trademark Title Services Inc | |
| Gm Homes Inc | $25,000 | -- | |
| Prenevost Roxy T | $106,084 | -- |
Source: Public Records
Mortgage History
| Date | Status | Borrower | Loan Amount |
|---|---|---|---|
| Open | Carlson Steven Marcus | $145,000 | |
| Previous Owner | Fialkowski Matthew | $124,000 |
Source: Public Records
Tax History Compared to Growth
Tax History
| Year | Tax Paid | Tax Assessment Tax Assessment Total Assessment is a certain percentage of the fair market value that is determined by local assessors to be the total taxable value of land and additions on the property. | Land | Improvement |
|---|---|---|---|---|
| 2023 | $3,034 | $255,500 | $80,000 | $175,500 |
| 2022 | $2,578 | $232,100 | $73,500 | $158,600 |
| 2021 | $2,458 | $205,200 | $65,000 | $140,200 |
| 2020 | $2,308 | $198,700 | $65,000 | $133,700 |
| 2019 | $2,388 | $184,800 | $50,000 | $134,800 |
| 2018 | $2,118 | $184,000 | $60,000 | $124,000 |
| 2017 | $1,890 | $163,600 | $45,000 | $118,600 |
| 2016 | $2,328 | $151,600 | $35,000 | $116,600 |
| 2015 | $1,976 | $142,800 | $25,900 | $116,900 |
| 2013 | -- | $115,100 | $20,700 | $94,400 |
Source: Public Records
Map
Nearby Homes
- 6147 Tahoe Cir Unit J
- 2692 Mallard Dr
- 2645 Mallard Dr
- 2712 New Century Place E
- 1077 Century Ave S
- 2651 New Century Blvd S
- 2517 Cobble Hill Ct Unit I
- 2841 Carver Park Cir
- 2790 Jordan Dr
- XXXX Sterling St S
- 6884 Lake Terrace W
- 6865 Macbeth Ct
- 7041 Aberdeen Curve
- 6822 Sherwood Rd
- 6951 Macbeth Cir
- 7070 Robinwood Trail
- 1590 Parkwood Dr Unit 314
- 6882 Romeo Rd
- 541 Deer Ridge Ln S
- 7217 Braemar Ln
- 6135 Tahoe Cir Unit B
- 6135 Tahoe Cir Unit A
- 6135 Tahoe Cir Unit C
- 6135 Tahoe Cir Unit D
- 6135 Tahoe Cir Unit E
- 6203 Courtly Rd Unit B
- 6203 Courtly Rd Unit D
- 6203 Courtly Rd Unit E
- 6203 Courtly Rd Unit A
- 6141 Tahoe Cir Unit A
- 6141 Tahoe Cir Unit B
- 6141 Tahoe Cir Unit D
- 6141 Tahoe Cir Unit C
- 6141 Tahoe Cir Unit E
- 6129 Tahoe Cir Unit D
- 6129 Tahoe Cir Unit G
- 6129 Tahoe Cir Unit E
- 6129 Tahoe Cir Unit H
- 6129 Tahoe Cir Unit B
- 6129 Tahoe Cir Unit A