
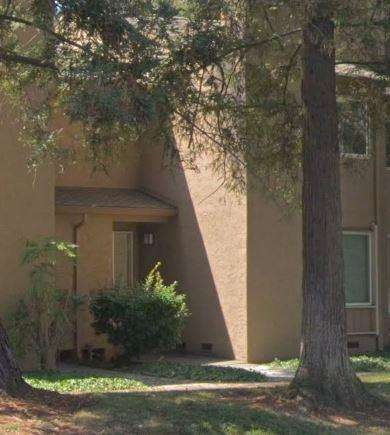
6137 Elmbridge Dr San Jose, CA 95129
West San Jose Neighborhood
3
Beds
2.5
Baths
1,214
Sq Ft
$305/mo
HOA Fee
Highlights
- Private Pool
- 2 Car Detached Garage
- Separate Family Room
- Nelson S. Dilworth Elementary School Rated A-
- Forced Air Heating System
- Dining Area
About This Home
As of January 2022This home is located at 6137 Elmbridge Dr, San Jose, CA 95129 and is currently priced at $1,500,000, approximately $1,235 per square foot. This property was built in 1971. 6137 Elmbridge Dr is a home located in Santa Clara County with nearby schools including Nelson S. Dilworth Elementary School, Joaquin Miller Middle, and Lynbrook High School.
Last Buyer's Agent
Ying Liu
Coldwell Banker Realty License #01917044
Townhouse Details
Home Type
- Townhome
Est. Annual Taxes
- $20,304
Year Built
- Built in 1971
HOA Fees
- $305 Monthly HOA Fees
Parking
- 2 Car Detached Garage
Home Design
- Composition Roof
Interior Spaces
- 1,214 Sq Ft Home
- 2-Story Property
- Wood Burning Fireplace
- Separate Family Room
- Dining Area
- Laminate Flooring
- Crawl Space
Bedrooms and Bathrooms
- 3 Bedrooms
Additional Features
- Private Pool
- 1,581 Sq Ft Lot
- Forced Air Heating System
Listing and Financial Details
- Assessor Parcel Number 377-07-032
Community Details
Overview
- Association fees include common area electricity, common area gas, insurance - common area, landscaping / gardening, maintenance - common area, management fee, pool spa or tennis, reserves, roof, water
- Regency Park Townhomes Association
Recreation
- Community Pool
Ownership History
Date
Name
Owned For
Owner Type
Purchase Details
Listed on
Nov 30, 2021
Closed on
Jan 7, 2022
Sold by
Jiang and Xiaoli
Bought by
Li Qike and Zhang Min
Seller's Agent
Jeff Peng
Maxreal
Buyer's Agent
Yali Zhang
Maxreal
List Price
$1,488,000
Sold Price
$1,550,000
Premium/Discount to List
$62,000
4.17%
Current Estimated Value
Home Financials for this Owner
Home Financials are based on the most recent Mortgage that was taken out on this home.
Estimated Appreciation
$199,107
Avg. Annual Appreciation
3.04%
Original Mortgage
$1,151,250
Outstanding Balance
$1,062,379
Interest Rate
2.38%
Mortgage Type
New Conventional
Estimated Equity
$652,419
Purchase Details
Listed on
Dec 29, 2017
Closed on
Dec 12, 2017
Sold by
Mohapatra Srikanta K and Mohapatra Smaranika
Bought by
Jiang Shuangshuang and Wei Xiaoli
Seller's Agent
Rebecca Lin
Maxreal
Buyer's Agent
Ying Liu
Coldwell Banker Realty
List Price
$1,500,000
Sold Price
$1,500,000
Home Financials for this Owner
Home Financials are based on the most recent Mortgage that was taken out on this home.
Avg. Annual Appreciation
0.81%
Original Mortgage
$1,125,000
Interest Rate
3.62%
Mortgage Type
Adjustable Rate Mortgage/ARM
Purchase Details
Closed on
Apr 1, 2013
Sold by
Kommoju Prasad and Kommoju Swaruparani
Bought by
Mohapatra Srikanta K and Mohapatra Smaranika
Home Financials for this Owner
Home Financials are based on the most recent Mortgage that was taken out on this home.
Original Mortgage
$625,000
Interest Rate
2.75%
Mortgage Type
New Conventional
Purchase Details
Closed on
Jan 24, 2005
Sold by
Wynn Ann E
Bought by
Kommoju Prasad and Kommoju Swaruparani
Home Financials for this Owner
Home Financials are based on the most recent Mortgage that was taken out on this home.
Original Mortgage
$500,000
Interest Rate
4.62%
Mortgage Type
Purchase Money Mortgage
Similar Homes in the area
Create a Home Valuation Report for This Property
The Home Valuation Report is an in-depth analysis detailing your home's value as well as a comparison with similar homes in the area
Home Values in the Area
Average Home Value in this Area
Purchase History
| Date | Type | Sale Price | Title Company |
|---|---|---|---|
| Grant Deed | $1,550,000 | Fidelity National Title | |
| Grant Deed | $1,500,000 | First American Title Co | |
| Grant Deed | $800,000 | Chicago Title Company | |
| Grant Deed | $670,000 | Chicago Title |
Source: Public Records
Mortgage History
| Date | Status | Loan Amount | Loan Type |
|---|---|---|---|
| Open | $1,151,250 | New Conventional | |
| Previous Owner | $1,099,000 | Adjustable Rate Mortgage/ARM | |
| Previous Owner | $1,125,000 | Adjustable Rate Mortgage/ARM | |
| Previous Owner | $625,000 | New Conventional | |
| Previous Owner | $600,000 | Unknown | |
| Previous Owner | $500,000 | Purchase Money Mortgage | |
| Previous Owner | $79,000 | Credit Line Revolving | |
| Previous Owner | $100,000 | Unknown | |
| Closed | $103,000 | No Value Available |
Source: Public Records
Property History
| Date | Event | Price | Change | Sq Ft Price |
|---|---|---|---|---|
| 01/19/2022 01/19/22 | Sold | $1,550,000 | +4.2% | $1,277 / Sq Ft |
| 12/19/2021 12/19/21 | Pending | -- | -- | -- |
| 11/30/2021 11/30/21 | For Sale | $1,488,000 | -0.8% | $1,226 / Sq Ft |
| 12/29/2017 12/29/17 | Sold | $1,500,000 | 0.0% | $1,236 / Sq Ft |
| 12/29/2017 12/29/17 | Pending | -- | -- | -- |
| 12/29/2017 12/29/17 | For Sale | $1,500,000 | -- | $1,236 / Sq Ft |
Source: MLSListings
Tax History Compared to Growth
Tax History
| Year | Tax Paid | Tax Assessment Tax Assessment Total Assessment is a certain percentage of the fair market value that is determined by local assessors to be the total taxable value of land and additions on the property. | Land | Improvement |
|---|---|---|---|---|
| 2024 | $20,304 | $1,612,620 | $806,310 | $806,310 |
| 2023 | $19,323 | $1,515,000 | $757,500 | $757,500 |
| 2022 | $20,660 | $1,608,300 | $804,150 | $804,150 |
| 2021 | $20,409 | $1,576,766 | $788,383 | $788,383 |
| 2020 | $20,061 | $1,560,600 | $780,300 | $780,300 |
| 2019 | $19,657 | $1,530,000 | $765,000 | $765,000 |
| 2018 | $19,106 | $1,500,000 | $750,000 | $750,000 |
| 2017 | $11,554 | $848,830 | $424,415 | $424,415 |
| 2016 | $11,207 | $832,188 | $416,094 | $416,094 |
| 2015 | $11,137 | $819,688 | $409,844 | $409,844 |
| 2014 | $10,511 | $803,632 | $401,816 | $401,816 |
Source: Public Records
Agents Affiliated with this Home
-
Jeff Peng
Seller's Agent in 2022
Jeff Peng
Maxreal
(408) 212-8796
16 in this area
123 Total Sales
-
Grace Zhou
G
Seller Co-Listing Agent in 2022
Grace Zhou
Maxreal
(408) 212-8800
1 in this area
7 Total Sales
-
Yali Zhang
Buyer's Agent in 2022
Yali Zhang
Maxreal
(650) 293-1664
2 in this area
8 Total Sales
-
Rebecca Lin
R
Seller's Agent in 2017
Rebecca Lin
Maxreal
(408) 212-8800
21 in this area
96 Total Sales
-
Kevin Qi
Seller Co-Listing Agent in 2017
Kevin Qi
Maxreal
(650) 207-6666
20 in this area
86 Total Sales
-
Buyer's Agent in 2017
Ying Liu
Coldwell Banker Realty
(408) 826-2548
110 Total Sales
Map
Source: MLSListings
MLS Number: ML81687729
APN: 377-07-032
Disclaimer: Certain information contained herein is derived from information provided by parties other than Homes.com. All information provided is deemed reliable, but is not guaranteed to be accurate and should be independently verified.
![]() Property Information © 2025 MLSListings Inc. All rights reserved. Listing information is deemed reliable but not guaranteed. Certain information contained herein is derived from information which is the licensed property of, and copyrighted by, MLSListings Inc. The viewer acknowledges ownership and validity of its copyright. Information provided is for personal, non-commercial use by a viewer with a bona fide interest in the purchase or sale of real estate of the type being offered via this website or other electronic means. The viewer is prohibited from copying, redistributing or retransmitting any of the data or information provided by MLSListing, Inc.
Property Information © 2025 MLSListings Inc. All rights reserved. Listing information is deemed reliable but not guaranteed. Certain information contained herein is derived from information which is the licensed property of, and copyrighted by, MLSListings Inc. The viewer acknowledges ownership and validity of its copyright. Information provided is for personal, non-commercial use by a viewer with a bona fide interest in the purchase or sale of real estate of the type being offered via this website or other electronic means. The viewer is prohibited from copying, redistributing or retransmitting any of the data or information provided by MLSListing, Inc.
Nearby Homes
- 6087 Bollinger Rd
- 938 Ferngrove Dr
- 6544 Bollinger Rd
- 5688 Kimberly St
- 10860 Johnson Ave
- 10735 Minette Dr
- 10623 Glenview Ave
- 1002 Oaktree Dr
- 18817 Tuggle Ave
- 5589 Ora St
- 1149 Danbury Dr
- 6509 Devonshire Dr
- 6083 W Walbrook Dr
- 1064 Wunderlich Dr
- 5631 Glen Haven Ct
- 1354 Bing Dr
- 6757 Devonshire Dr
- 6924 Bollinger Rd
- 10271 Menhart Ln
- 844 Doyle Rd