6138 Firestone Dr Fontana, CA 92336
Sierra Lakes NeighborhoodEstimated Value: $697,313 - $721,000
3
Beds
2
Baths
1,853
Sq Ft
$384/Sq Ft
Est. Value
About This Home
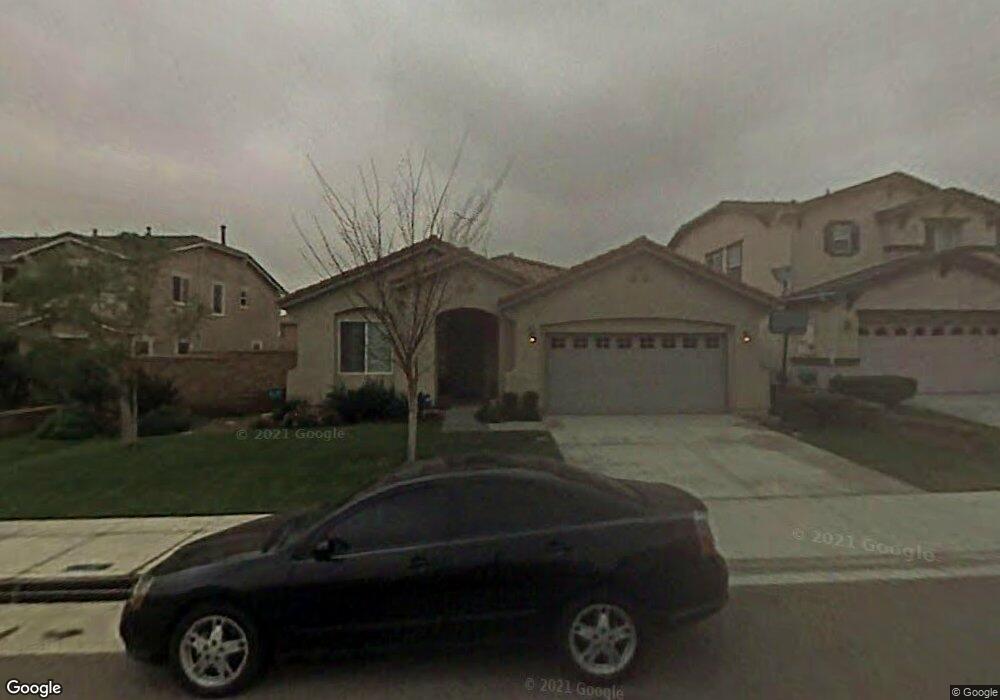
This home is located at 6138 Firestone Dr, Fontana, CA 92336 and is currently estimated at $711,078, approximately $383 per square foot. 6138 Firestone Dr is a home located in San Bernardino County with nearby schools including Sierra Lakes Elementary School, Wayne Ruble Middle School, and Summit High School.
Ownership History
Date
Name
Owned For
Owner Type
Purchase Details
Closed on
Jan 5, 2019
Sold by
Medina Frank and Medina Lilia J
Bought by
Medina Frank and Medina Lilia J
Current Estimated Value
Purchase Details
Closed on
Apr 7, 2010
Sold by
Kronk Patrick J
Bought by
Medina Frank
Home Financials for this Owner
Home Financials are based on the most recent Mortgage that was taken out on this home.
Original Mortgage
$275,702
Outstanding Balance
$182,898
Interest Rate
4.92%
Mortgage Type
VA
Estimated Equity
$528,180
Purchase Details
Closed on
Oct 29, 2002
Sold by
Kb Home Greater Los Angeles Inc
Bought by
Kronk Patrick J and Kronk Janette M
Home Financials for this Owner
Home Financials are based on the most recent Mortgage that was taken out on this home.
Original Mortgage
$236,450
Interest Rate
5.71%
Create a Home Valuation Report for This Property
The Home Valuation Report is an in-depth analysis detailing your home's value as well as a comparison with similar homes in the area
Home Values in the Area
Average Home Value in this Area
Purchase History
| Date | Buyer | Sale Price | Title Company |
|---|---|---|---|
| Medina Frank | -- | None Available | |
| Medina Frank | -- | None Available | |
| Medina Frank | $270,000 | Stewart Title Company | |
| Kronk Patrick J | $296,000 | First American |
Source: Public Records
Mortgage History
| Date | Status | Borrower | Loan Amount |
|---|---|---|---|
| Open | Medina Frank | $275,702 | |
| Previous Owner | Kronk Patrick J | $236,450 | |
| Closed | Kronk Patrick J | $44,300 |
Source: Public Records
Tax History Compared to Growth
Tax History
| Year | Tax Paid | Tax Assessment Tax Assessment Total Assessment is a certain percentage of the fair market value that is determined by local assessors to be the total taxable value of land and additions on the property. | Land | Improvement |
|---|---|---|---|---|
| 2025 | $5,974 | $348,522 | $103,265 | $245,257 |
| 2024 | $5,974 | $341,688 | $101,240 | $240,448 |
| 2023 | $5,404 | $334,988 | $99,255 | $235,733 |
| 2022 | $5,375 | $328,420 | $97,309 | $231,111 |
| 2021 | $5,309 | $321,980 | $95,401 | $226,579 |
| 2020 | $5,376 | $318,679 | $94,423 | $224,256 |
| 2019 | $5,263 | $312,431 | $92,572 | $219,859 |
| 2018 | $5,305 | $306,305 | $90,757 | $215,548 |
| 2017 | $5,239 | $300,299 | $88,977 | $211,322 |
| 2016 | $5,150 | $294,410 | $87,232 | $207,178 |
| 2015 | $5,126 | $289,988 | $85,922 | $204,066 |
| 2014 | $5,097 | $284,308 | $84,239 | $200,069 |
Source: Public Records
Map
Nearby Homes
- 6112 Firestone Dr
- 16838 Kittansett Place
- 16780 Spy Glass Ct
- 6065 Camargo Place
- 6031 Medinah St
- 16850 Merion Ln
- 5794 Bay Hill Ln
- 16681 Escalon Dr
- 6219 S Kingsmill Ct
- 16448 Los Coyotes St
- 16369 Medinah St
- 6079 Bel Air Dr
- 6158 Bel Air Dr
- 6257 Long Cove Dr
- 16570 Wyndham Ln Unit 12
- 5929 Big Horn Place
- 15707 Highland Ave
- 5591 Royal Oaks Way
- 16763 Stags Leap Ln
- 5859 Seminole Way
- 6148 Firestone Dr
- 6130 Firestone Dr
- 6158 Firestone Dr
- 16834 Scioto Place
- 16831 Scioto Place
- 6166 Firestone Dr
- 16789 Inverness Ln
- 16786 Broadmoor Way
- 16842 Scioto Place
- 16841 Scioto Place
- 16833 Cascades Place
- 16783 Inverness Ln
- 6172 Firestone Dr
- 16782 Broadmoor Way
- 6106 Firestone Dr
- 16830 Kittansett Place
- 16848 Scioto Place
- 6121 Homestead Way
- 16841 Cascades Place
- 16847 Scioto Place