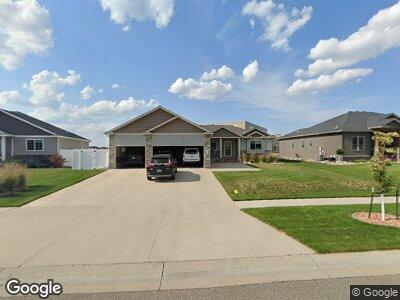
614 29th Ave E West Fargo, ND 58078
The Preserve NeighborhoodEstimated Value: $534,000 - $572,535
3
Beds
2
Baths
1,636
Sq Ft
$338/Sq Ft
Est. Value
About This Home
This home is located at 614 29th Ave E, West Fargo, ND 58078 and is currently estimated at $553,268, approximately $338 per square foot. 614 29th Ave E is a home located in Cass County with nearby schools including Freedom Elementary School, Liberty Middle School, and West Fargo Sheyenne High School.
Ownership History
Date
Name
Owned For
Owner Type
Purchase Details
Closed on
Aug 15, 2013
Sold by
Krueger Construction Inc
Bought by
Olson Derrick E and Olson Andrea M
Current Estimated Value
Home Financials for this Owner
Home Financials are based on the most recent Mortgage that was taken out on this home.
Original Mortgage
$244,700
Outstanding Balance
$185,930
Interest Rate
4.25%
Mortgage Type
New Conventional
Estimated Equity
$321,430
Purchase Details
Closed on
Oct 19, 2012
Sold by
Rusty Goose Development Lllp
Bought by
Krueger Construction Inc
Home Financials for this Owner
Home Financials are based on the most recent Mortgage that was taken out on this home.
Original Mortgage
$209,250
Interest Rate
3.53%
Mortgage Type
Purchase Money Mortgage
Purchase Details
Closed on
Oct 15, 2012
Sold by
Rusty Goose Development Lllp
Bought by
Krueger Construction Inc
Home Financials for this Owner
Home Financials are based on the most recent Mortgage that was taken out on this home.
Original Mortgage
$209,250
Interest Rate
3.53%
Mortgage Type
Purchase Money Mortgage
Create a Home Valuation Report for This Property
The Home Valuation Report is an in-depth analysis detailing your home's value as well as a comparison with similar homes in the area
Home Values in the Area
Average Home Value in this Area
Purchase History
| Date | Buyer | Sale Price | Title Company |
|---|---|---|---|
| Olson Derrick E | $288,225 | Title Co | |
| Krueger Construction Inc | -- | None Available | |
| Krueger Construction Inc | -- | Title Co |
Source: Public Records
Mortgage History
| Date | Status | Borrower | Loan Amount |
|---|---|---|---|
| Closed | Olsen Derrick E | $27,400 | |
| Closed | Olson Derrick E | $17,000 | |
| Open | Olson Derrick E | $244,700 | |
| Previous Owner | Krueger Construction Inc | $209,250 |
Source: Public Records
Tax History Compared to Growth
Tax History
| Year | Tax Paid | Tax Assessment Tax Assessment Total Assessment is a certain percentage of the fair market value that is determined by local assessors to be the total taxable value of land and additions on the property. | Land | Improvement |
|---|---|---|---|---|
| 2024 | $8,313 | $231,250 | $44,000 | $187,250 |
| 2023 | $8,590 | $220,150 | $44,000 | $176,150 |
| 2022 | $8,385 | $205,550 | $44,000 | $161,550 |
| 2021 | $8,074 | $189,450 | $36,000 | $153,450 |
| 2020 | $7,975 | $187,650 | $36,000 | $151,650 |
| 2019 | $8,161 | $190,550 | $36,000 | $154,550 |
| 2018 | $8,144 | $193,700 | $36,000 | $157,700 |
| 2017 | $7,994 | $193,700 | $36,000 | $157,700 |
| 2016 | $7,475 | $193,450 | $36,000 | $157,450 |
| 2015 | $5,107 | $84,150 | $28,100 | $56,050 |
| 2014 | $4,947 | $148,750 | $28,100 | $120,650 |
| 2013 | $3,832 | $28,600 | $20,350 | $8,250 |
Source: Public Records
Map
Nearby Homes