Estimated Value: $355,000 - $413,000
4
Beds
3
Baths
2,100
Sq Ft
$185/Sq Ft
Est. Value
About This Home
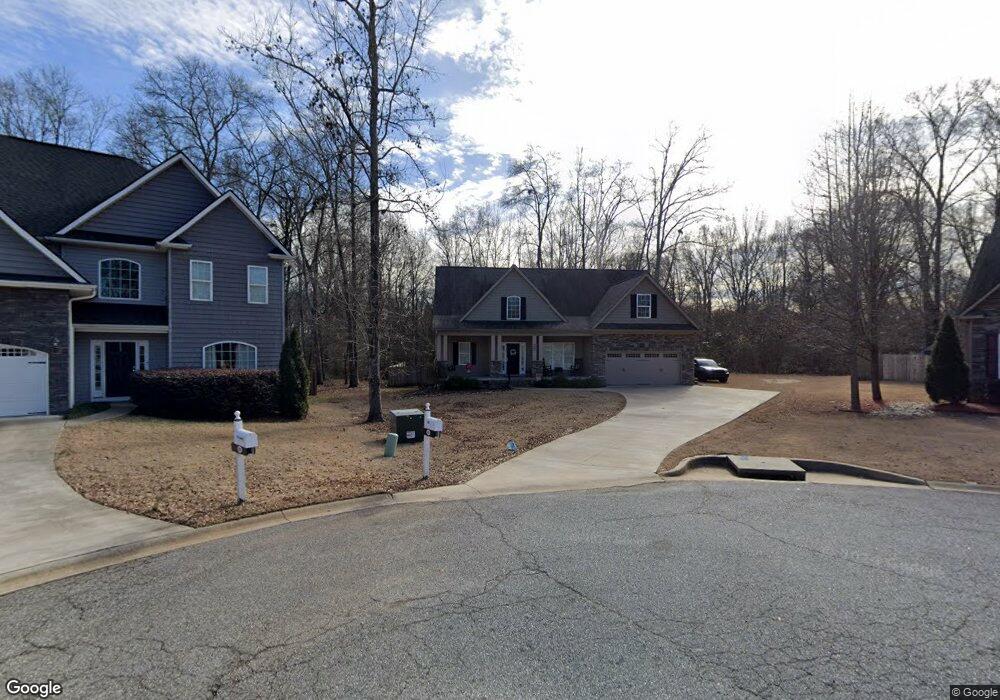
This home is located at 614 Clovis Ct, Moore, SC 29369 and is currently estimated at $388,107, approximately $184 per square foot. 614 Clovis Ct is a home located in Spartanburg County with nearby schools including Dorman High School Freshman Campus and Dorman High School.
Ownership History
Date
Name
Owned For
Owner Type
Purchase Details
Closed on
Dec 1, 2025
Sold by
Sill Jessie C and Sill Bradley W
Bought by
Bradley West Sill And Jessie Cox Sill Living and Sill
Current Estimated Value
Purchase Details
Closed on
Jul 16, 2021
Sold by
Sill Jessie C and Cox Jessie S
Bought by
Sill Jessie C and Sill Bradley W
Home Financials for this Owner
Home Financials are based on the most recent Mortgage that was taken out on this home.
Original Mortgage
$208,500
Interest Rate
2.88%
Purchase Details
Closed on
Nov 6, 2015
Sold by
Sill Real Estate & Construction Inc
Bought by
Cox Jessie S and Cox Beth E
Home Financials for this Owner
Home Financials are based on the most recent Mortgage that was taken out on this home.
Original Mortgage
$221,906
Interest Rate
4.25%
Mortgage Type
FHA
Purchase Details
Closed on
Oct 1, 2015
Sold by
Mill Creek Developers Llc
Bought by
Sill Real Estate And Construction Inc
Home Financials for this Owner
Home Financials are based on the most recent Mortgage that was taken out on this home.
Original Mortgage
$221,906
Interest Rate
4.25%
Mortgage Type
FHA
Create a Home Valuation Report for This Property
The Home Valuation Report is an in-depth analysis detailing your home's value as well as a comparison with similar homes in the area
Home Values in the Area
Average Home Value in this Area
Purchase History
| Date | Buyer | Sale Price | Title Company |
|---|---|---|---|
| Bradley West Sill And Jessie Cox Sill Living | -- | None Listed On Document | |
| Bradley West Sill And Jessie Cox Sill Living | -- | None Listed On Document | |
| Sill Jessie C | -- | None Available | |
| Sill Jessie C | -- | None Available | |
| Cox Jessie S | $226,000 | None Available | |
| Sill Real Estate And Construction Inc | $39,000 | Attorney |
Source: Public Records
Mortgage History
| Date | Status | Borrower | Loan Amount |
|---|---|---|---|
| Previous Owner | Sill Jessie C | $208,500 | |
| Previous Owner | Cox Jessie S | $221,906 |
Source: Public Records
Tax History
| Year | Tax Paid | Tax Assessment Tax Assessment Total Assessment is a certain percentage of the fair market value that is determined by local assessors to be the total taxable value of land and additions on the property. | Land | Improvement |
|---|---|---|---|---|
| 2025 | $1,924 | $11,537 | $1,550 | $9,987 |
| 2023 | $1,924 | $11,537 | $1,550 | $9,987 |
| 2022 | $1,781 | $10,032 | $1,556 | $8,476 |
| 2021 | $1,781 | $10,032 | $1,556 | $8,476 |
| 2020 | $1,739 | $10,032 | $1,556 | $8,476 |
| 2019 | $1,724 | $10,032 | $1,556 | $8,476 |
| 2018 | $1,709 | $10,032 | $1,556 | $8,476 |
| 2017 | $1,523 | $9,076 | $1,572 | $7,504 |
| 2016 | $1,491 | $9,076 | $1,572 | $7,504 |
| 2015 | $80 | $234 | $234 | $0 |
| 2014 | $78 | $234 | $234 | $0 |
Source: Public Records
Map
Nearby Homes
- 130 Darmondale Dr
- 450 Lynnell Way
- 424 Grand Oak Way
- 738 Judah Dr
- 224 Saddlebrook Dr
- 419 Vestry Place
- 547 Chantry Ln
- 512 Furman Creek Ct
- 371 Kelly Farm Rd
- 00 Bobo Lake Rd
- 759 Rodin Rd
- 767 Rodin Rd
- 789 Baker Way
- 641 Monfret Ct
- 101 Stockton Ln
- 1474 Wild Indigo Way
- 1496 Wild Indigo Way
- 1343 Pitch Pine Place
- 631 Monfret Ct
- 1478 Wild Indigo Way
- 613 Clovis Ct
- 610 Clovis Ct
- 440 S Pendernale Dr
- 606 Clovis Ct
- 609 Clovis Ct
- 441 S Pendernale Dr
- 436 Pendernale Dr
- 535 Winsland Way
- 539 Winsland Way
- 531 Winsland Way
- 439 S Pendernale Dr
- 432 S Pendernale Dr
- 555 Riveredge Ct
- 527 Winsland Way
- 521 Winsland Way
- 435 S Pendernale Dr
- 543 Winsland Way
- 428 S Pendernale Dr
- 538 Winsland Way
- 534 Winsland Way
Your Personal Tour Guide
Ask me questions while you tour the home.