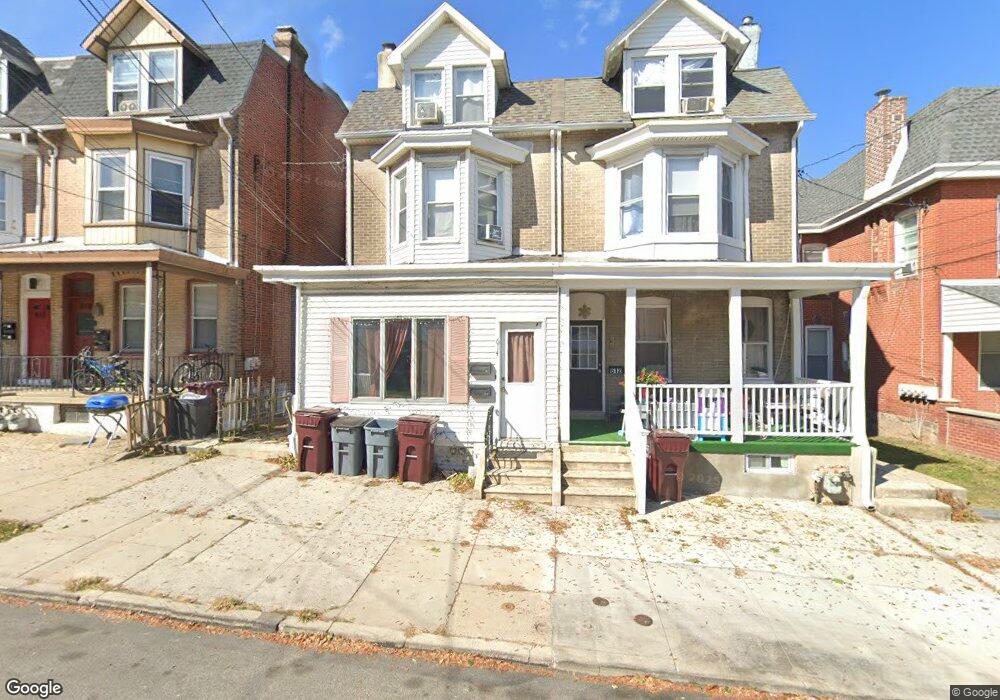
614 Dekalb St Bridgeport, PA 19405
Estimated Value: $358,000 - $396,000
2
Beds
2
Baths
1,824
Sq Ft
$208/Sq Ft
Est. Value
About This Home
This home is located at 614 Dekalb St, Bridgeport, PA 19405 and is currently estimated at $379,193, approximately $207 per square foot. 614 Dekalb St is a home located in Montgomery County with nearby schools including Bridgeport Elementary School, Upper Merion Middle School, and Upper Merion High School.
Ownership History
Date
Name
Owned For
Owner Type
Purchase Details
Closed on
Oct 20, 2010
Sold by
Agnihotri Pradip
Bought by
Agnihotri Pradip and Agnihotri Anisha
Current Estimated Value
Home Financials for this Owner
Home Financials are based on the most recent Mortgage that was taken out on this home.
Original Mortgage
$157,500
Outstanding Balance
$104,250
Interest Rate
4.41%
Estimated Equity
$274,943
Purchase Details
Closed on
Jan 5, 2005
Sold by
Kane Andrew J and Kane Georgiana Bell
Bought by
Agnihotri Pradip
Home Financials for this Owner
Home Financials are based on the most recent Mortgage that was taken out on this home.
Original Mortgage
$172,000
Interest Rate
5.71%
Mortgage Type
New Conventional
Purchase Details
Closed on
May 24, 2001
Sold by
Kane Georgiana Bell
Bought by
Kane Andrew J and Kane Georgiana Bell
Purchase Details
Closed on
Mar 3, 1999
Sold by
Bell Frieda A and Bell Anastasia
Bought by
Kane Georgiana Bell
Create a Home Valuation Report for This Property
The Home Valuation Report is an in-depth analysis detailing your home's value as well as a comparison with similar homes in the area
Home Values in the Area
Average Home Value in this Area
Purchase History
| Date | Buyer | Sale Price | Title Company |
|---|---|---|---|
| Agnihotri Pradip | -- | None Available | |
| Agnihotri Pradip | $215,000 | -- | |
| Kane Andrew J | -- | -- | |
| Kane Georgiana Bell | -- | -- |
Source: Public Records
Mortgage History
| Date | Status | Borrower | Loan Amount |
|---|---|---|---|
| Open | Agnihotri Pradip | $157,500 | |
| Closed | Agnihotri Pradip | $172,000 |
Source: Public Records
Tax History Compared to Growth
Tax History
| Year | Tax Paid | Tax Assessment Tax Assessment Total Assessment is a certain percentage of the fair market value that is determined by local assessors to be the total taxable value of land and additions on the property. | Land | Improvement |
|---|---|---|---|---|
| 2025 | $3,986 | $101,180 | $36,450 | $64,730 |
| 2024 | $3,986 | $101,180 | $36,450 | $64,730 |
| 2023 | $3,876 | $101,180 | $36,450 | $64,730 |
| 2022 | $3,774 | $101,180 | $36,450 | $64,730 |
| 2021 | $3,745 | $101,180 | $36,450 | $64,730 |
| 2020 | $3,685 | $101,180 | $36,450 | $64,730 |
| 2019 | $3,639 | $101,180 | $36,450 | $64,730 |
| 2018 | $3,638 | $101,180 | $36,450 | $64,730 |
| 2017 | $3,545 | $101,180 | $36,450 | $64,730 |
| 2016 | $3,505 | $101,180 | $36,450 | $64,730 |
| 2015 | $3,505 | $101,180 | $36,450 | $64,730 |
| 2014 | $3,414 | $101,180 | $36,450 | $64,730 |
Source: Public Records
Map
Nearby Homes
- 612 Dekalb St
- 608 Dekalb St Unit 3
- 608 Dekalb St
- 608 Dekalb St Unit 2
- 616 Dekalb St
- 618 Dekalb St Unit 1
- 618 Dekalb St
- 618 Dekalb St Unit 2
- 604 Dekalb St
- 620 Dekalb St
- 602 Dekalb St
- 314 W 6th St
- 622 Dekalb St Unit 1
- 622 Dekalb St
- 622 Dekalb St Unit 2nd floor
- 622 Dekalb St
- 316 W 6th St
- 600 Dekalb St
- 304 W 6th St Unit 3
- 304 W 6th St