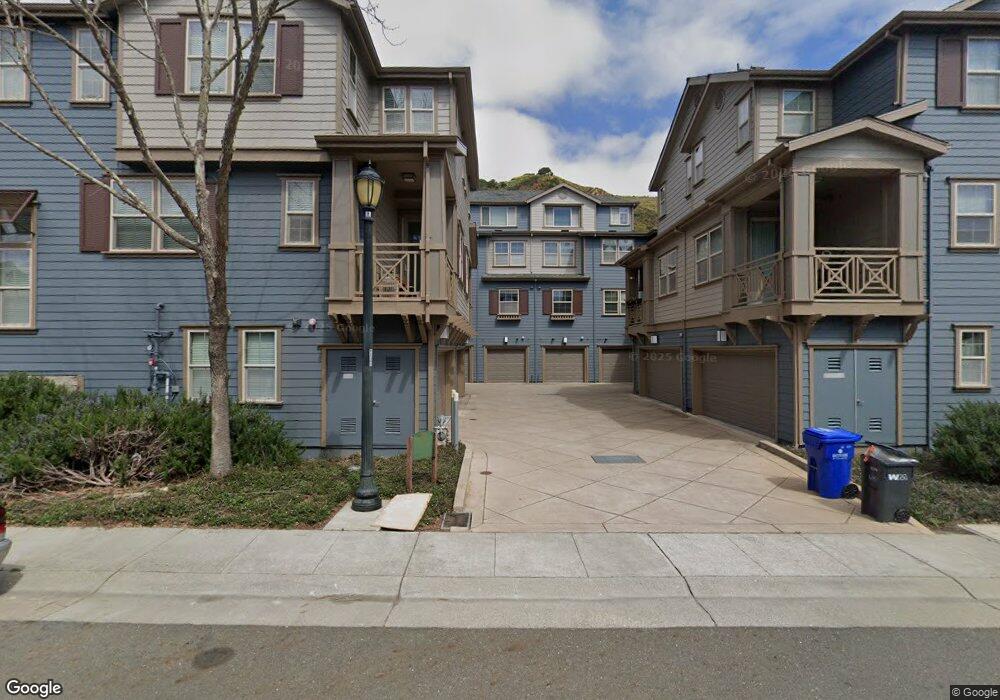
6146 Old Quarry Loop Unit 4506 Oakland, CA 94605
Caballo Hills NeighborhoodEstimated Value: $666,412 - $743,000
2
Beds
3
Baths
1,802
Sq Ft
$388/Sq Ft
Est. Value
About This Home
This home is located at 6146 Old Quarry Loop Unit 4506, Oakland, CA 94605 and is currently estimated at $699,603, approximately $388 per square foot. 6146 Old Quarry Loop Unit 4506 is a home located in Alameda County with nearby schools including Burckhalter Elementary School, Frick United Academy of Language, and Skyline High School.
Ownership History
Date
Name
Owned For
Owner Type
Purchase Details
Closed on
Apr 28, 2020
Sold by
Ip Hin Shing
Bought by
Ip Hin Shing and Chen Cynthia
Current Estimated Value
Purchase Details
Closed on
Apr 4, 2016
Sold by
Ward Adam C
Bought by
Ip Hin Shing
Home Financials for this Owner
Home Financials are based on the most recent Mortgage that was taken out on this home.
Original Mortgage
$448,000
Outstanding Balance
$355,206
Interest Rate
3.62%
Mortgage Type
New Conventional
Estimated Equity
$344,397
Purchase Details
Closed on
Mar 24, 2009
Sold by
Leona Llc
Bought by
Ward Adam C
Home Financials for this Owner
Home Financials are based on the most recent Mortgage that was taken out on this home.
Original Mortgage
$343,660
Interest Rate
5.15%
Mortgage Type
FHA
Create a Home Valuation Report for This Property
The Home Valuation Report is an in-depth analysis detailing your home's value as well as a comparison with similar homes in the area
Home Values in the Area
Average Home Value in this Area
Purchase History
| Date | Buyer | Sale Price | Title Company |
|---|---|---|---|
| Ip Hin Shing | -- | Solidifi Title & Closing | |
| Ip Hin Shing | $560,000 | Fidelity National Title Co | |
| Ward Adam C | $350,500 | Old Republic Title Company |
Source: Public Records
Mortgage History
| Date | Status | Borrower | Loan Amount |
|---|---|---|---|
| Open | Ip Hin Shing | $448,000 | |
| Previous Owner | Ward Adam C | $343,660 |
Source: Public Records
Tax History
| Year | Tax Paid | Tax Assessment Tax Assessment Total Assessment is a certain percentage of the fair market value that is determined by local assessors to be the total taxable value of land and additions on the property. | Land | Improvement |
|---|---|---|---|---|
| 2025 | $9,899 | $655,910 | $198,873 | $464,037 |
| 2024 | $9,899 | $642,913 | $194,974 | $454,939 |
| 2023 | $10,393 | $637,173 | $191,152 | $446,021 |
| 2022 | $10,122 | $617,680 | $187,404 | $437,276 |
| 2021 | $9,684 | $605,431 | $183,729 | $428,702 |
| 2020 | $9,577 | $606,154 | $181,846 | $424,308 |
| 2019 | $10,765 | $594,271 | $178,281 | $415,990 |
| 2018 | $10,516 | $582,623 | $174,787 | $407,836 |
| 2017 | $10,108 | $571,200 | $171,360 | $399,840 |
| 2016 | $7,451 | $381,269 | $114,326 | $266,943 |
| 2015 | $7,376 | $375,546 | $112,610 | $262,936 |
| 2014 | $7,381 | $368,192 | $110,405 | $257,787 |
Source: Public Records
Map
Nearby Homes
- 6067 Old Quarry Loop Unit 4306
- 6020 Old Quarry Loop
- 6246 Boulder Ln Unit 4807
- 6271 Rocky Point Ct
- 6466 Bayview Dr
- 6299 Rocky Point Ct
- 6440 Sunnymere Ave
- 3920 Edgemoor Place
- 6401 Leona St
- 6927 Sunkist Dr
- 13367 Campus Dr
- 7333 Sunkist Dr
- 4200 Mountain View Ave
- 6400 Mokelumne Ave
- 6208 Oakdale Ave
- 6871 Simson St
- 7106 Outlook Ave
- 6193 Oakdale Ave
- 4903 Stoneridge Ct
- 7565 Hillmont Dr
- 6142 Old Quarry Loop
- 6138 Old Quarry Loop Unit 4510
- 6138 Old Quarry Loop
- 6148 Old Quarry Loop Unit 4505
- 6152 Old Quarry Loop Unit 4503
- 6156 Old Quarry Loop
- 6150 Old Quarry Loop
- 6154 Old Quarry Loop
- 6140 Old Quarry Loop
- 6144 Old Quarry Loop
- 6128 Old Quarry Loop
- 6158 Old Quarry Loop
- 6166 Old Quarry Loop
- 6172 Old Quarry Loop
- 6122 Old Quarry Loop
- 6126 Old Quarry Loop
- 6134 Old Quarry Loop
- 6162 Old Quarry Loop
- 6176 Old Quarry Loop
- 6160 Old Quarry Loop Unit 4609
Your Personal Tour Guide
Ask me questions while you tour the home.