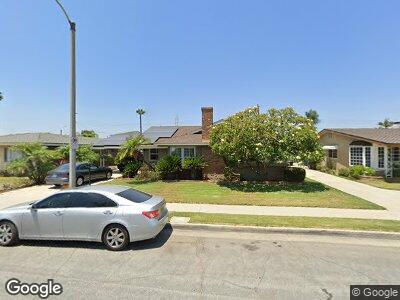
6147 Manzanar Ave Pico Rivera, CA 90660
Estimated Value: $753,000 - $795,000
3
Beds
2
Baths
1,406
Sq Ft
$553/Sq Ft
Est. Value
About This Home
This home is located at 6147 Manzanar Ave, Pico Rivera, CA 90660 and is currently estimated at $777,983, approximately $553 per square foot. 6147 Manzanar Ave is a home located in Los Angeles County with nearby schools including Rio Vista Elementary School, Ruben Salazar Continuation School, and El Rancho High School.
Ownership History
Date
Name
Owned For
Owner Type
Purchase Details
Closed on
Mar 12, 2010
Sold by
Calderon John A and The John A Calderon Living Tru
Bought by
Calderon John A
Current Estimated Value
Purchase Details
Closed on
Jan 29, 2009
Sold by
Calderon John A
Bought by
Calderon John A and The John A Calderon Living Trust
Home Financials for this Owner
Home Financials are based on the most recent Mortgage that was taken out on this home.
Original Mortgage
$26,000
Interest Rate
5.04%
Mortgage Type
Credit Line Revolving
Purchase Details
Closed on
Apr 15, 2005
Sold by
Calderon John A
Bought by
Calderon John A and John A Calderon Living Trust
Create a Home Valuation Report for This Property
The Home Valuation Report is an in-depth analysis detailing your home's value as well as a comparison with similar homes in the area
Home Values in the Area
Average Home Value in this Area
Purchase History
| Date | Buyer | Sale Price | Title Company |
|---|---|---|---|
| Calderon John A | -- | None Available | |
| Calderon John A | -- | Accommodation | |
| Calderon John A | -- | Accommodation | |
| Calderon John A | -- | -- |
Source: Public Records
Mortgage History
| Date | Status | Borrower | Loan Amount |
|---|---|---|---|
| Closed | Calderon John A | $170,000 | |
| Closed | Calderon John A | $40,000 | |
| Closed | Calderon John A | $151,868 | |
| Closed | Calderon John A | $26,000 | |
| Closed | Calderon John | $100,000 | |
| Closed | Calderon John A | $100,000 | |
| Closed | Calderon John A | $178,500 | |
| Closed | Calderon John A | $50,000 | |
| Closed | Calderon John A | $180,000 | |
| Closed | Calderon John A | $20,000 |
Source: Public Records
Tax History Compared to Growth
Tax History
| Year | Tax Paid | Tax Assessment Tax Assessment Total Assessment is a certain percentage of the fair market value that is determined by local assessors to be the total taxable value of land and additions on the property. | Land | Improvement |
|---|---|---|---|---|
| 2024 | $3,496 | $211,128 | $71,381 | $139,747 |
| 2023 | $3,403 | $206,989 | $69,982 | $137,007 |
| 2022 | $3,256 | $202,931 | $68,610 | $134,321 |
| 2021 | $3,150 | $198,953 | $67,265 | $131,688 |
| 2019 | $3,119 | $193,054 | $65,271 | $127,783 |
| 2018 | $2,880 | $189,270 | $63,992 | $125,278 |
| 2016 | $6,444 | $181,922 | $61,508 | $120,414 |
| 2015 | $2,567 | $179,191 | $60,585 | $118,606 |
| 2014 | $2,541 | $175,682 | $59,399 | $116,283 |
Source: Public Records
Map
Nearby Homes
- 8873 Coolhurst Dr
- 6526 Crossway Dr
- 6618 Phaeton Ave
- 8913 Bexley Dr
- 5503 Dowling Ave
- 9239 Mines Ave
- 9347 Via Azul
- 9357 Via Azul
- 9349 Via Azul
- 9355 Via Azul
- 5328 Lemoran Ave
- 9412 Haney St
- 5101 Lindsey Ave
- 128 W Roosevelt Ave
- 7019 Passons Blvd
- 932 S 5th St
- 8827 West Blvd
- 9235 Danbridge St
- 540 S 6th St
- 7244 Bequette Ave
- 6147 Manzanar Ave
- 6141 Manzanar Ave
- 6155 Manzanar Ave
- 6144 Maris Ave
- 6150 Maris Ave
- 6136 Maris Ave
- 6135 Manzanar Ave
- 6161 Manzanar Ave
- 6146 Manzanar Ave
- 6128 Maris Ave
- 6154 Maris Ave
- 6140 Manzanar Ave
- 6152 Manzanar Ave
- 6127 Manzanar Ave
- 6134 Manzanar Ave
- 6160 Manzanar Ave
- 6124 Maris Ave
- 6126 Manzanar Ave
- 6143 Maris Ave
- 6202 Maris Ave